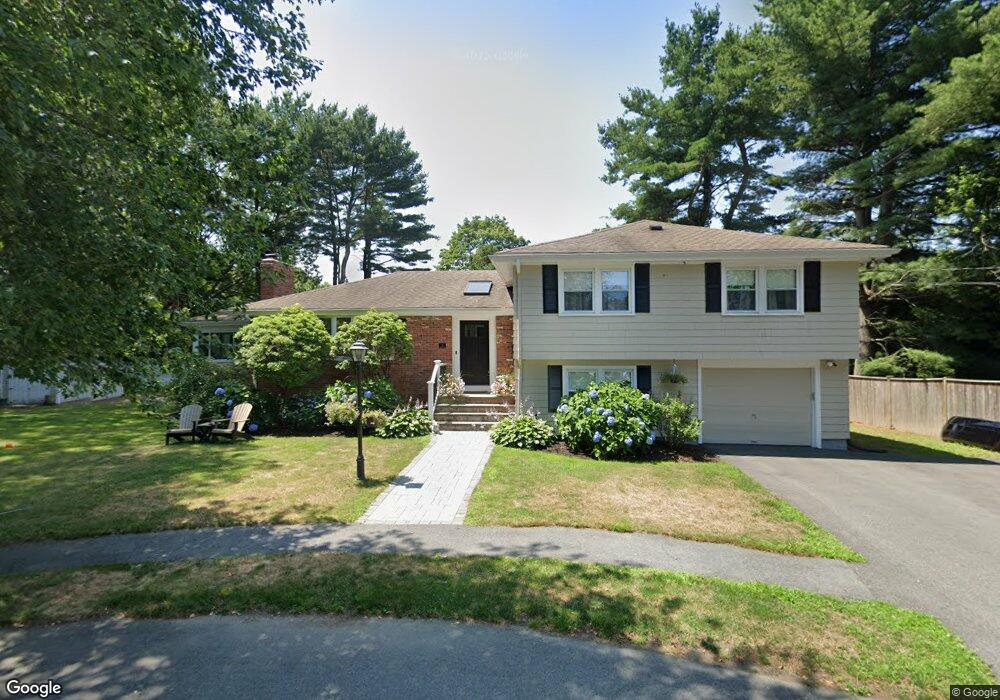
51 Sevinor Rd Marblehead, MA 01945
Estimated Value: $1,027,000 - $1,209,000
4
Beds
2
Baths
2,379
Sq Ft
$470/Sq Ft
Est. Value
About This Home
This home is located at 51 Sevinor Rd, Marblehead, MA 01945 and is currently estimated at $1,116,983, approximately $469 per square foot. 51 Sevinor Rd is a home located in Essex County with nearby schools including Marblehead High School, Tower School, and Devereux School.
Ownership History
Date
Name
Owned For
Owner Type
Purchase Details
Closed on
Feb 5, 2021
Sold by
Gansenberg Debra F and Gansenberg Walter G
Bought by
51 Sevinor Road Rt
Current Estimated Value
Purchase Details
Closed on
Sep 15, 2006
Sold by
Pless Misha and Pless Patricia
Bought by
Gansenberg Walter G and Gansenberg Debra F
Purchase Details
Closed on
Nov 25, 2003
Sold by
Goldstein Marc G and Goldstein Mary A
Bought by
Pless Misha
Create a Home Valuation Report for This Property
The Home Valuation Report is an in-depth analysis detailing your home's value as well as a comparison with similar homes in the area
Home Values in the Area
Average Home Value in this Area
Purchase History
| Date | Buyer | Sale Price | Title Company |
|---|---|---|---|
| 51 Sevinor Road Rt | -- | None Available | |
| 51 Sevinor Road Rt | -- | None Available | |
| 51 Sevinor Road Rt | -- | None Available | |
| Gansenberg Walter G | $630,000 | -- | |
| Gansenberg Walter G | $630,000 | -- | |
| Pless Misha | $601,000 | -- | |
| Pless Misha | $601,000 | -- |
Source: Public Records
Mortgage History
| Date | Status | Borrower | Loan Amount |
|---|---|---|---|
| Previous Owner | Pless Misha | $286,500 | |
| Previous Owner | Pless Misha | $290,000 |
Source: Public Records
Tax History Compared to Growth
Tax History
| Year | Tax Paid | Tax Assessment Tax Assessment Total Assessment is a certain percentage of the fair market value that is determined by local assessors to be the total taxable value of land and additions on the property. | Land | Improvement |
|---|---|---|---|---|
| 2025 | $8,617 | $952,100 | $612,700 | $339,400 |
| 2024 | $8,400 | $937,500 | $626,300 | $311,200 |
| 2023 | $8,318 | $831,800 | $551,400 | $280,400 |
| 2022 | $7,908 | $751,700 | $490,100 | $261,600 |
| 2021 | $7,500 | $719,800 | $462,900 | $256,900 |
| 2020 | $7,088 | $682,200 | $462,900 | $219,300 |
| 2019 | $6,855 | $638,300 | $422,100 | $216,200 |
| 2018 | $6,733 | $611,000 | $394,800 | $216,200 |
| 2017 | $6,577 | $597,400 | $381,200 | $216,200 |
| 2016 | $6,329 | $570,200 | $354,000 | $216,200 |
| 2015 | $5,715 | $515,800 | $299,500 | $216,300 |
| 2014 | $5,502 | $496,100 | $272,300 | $223,800 |
Source: Public Records
Map
Nearby Homes
- 3 Oak St
- 34 Lafayette St
- 2 Martin St
- 25 Tedesco St
- 30 Amherst Rd
- 83 Lafayette St
- 282 Pleasant St
- 201 Humphrey St Unit 2
- 212 Humphrey St Unit 205
- 6 Higgins Rd
- 19 Elmwood Rd
- 179 Beach Bluff Ave
- 48 Bellevue Rd
- 70 Maverick St
- 25 Manton Rd
- 37 Stanley Rd
- 41 Rowland St
- 29 Village St Unit 1
- 12 Heritage Way Unit 12
- 100 Village St