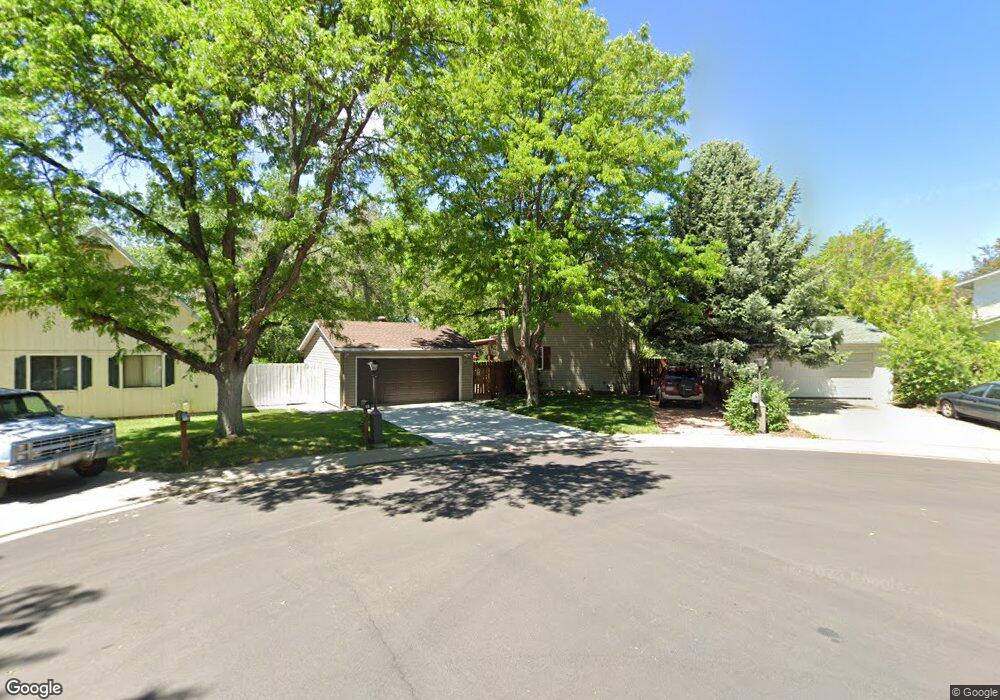
51 Spring Dale Place Longmont, CO 80504
Clark Centennial NeighborhoodEstimated Value: $489,000 - $518,000
3
Beds
2
Baths
1,764
Sq Ft
$286/Sq Ft
Est. Value
About This Home
This home is located at 51 Spring Dale Place, Longmont, CO 80504 and is currently estimated at $504,540, approximately $286 per square foot. 51 Spring Dale Place is a home located in Boulder County with nearby schools including Timberline Pk-8, Skyline High School, and Longmont Christian School.
Ownership History
Date
Name
Owned For
Owner Type
Purchase Details
Closed on
Aug 14, 2017
Sold by
Lanier Nathan and Lanier Tracy R
Bought by
Lanier Nathan
Current Estimated Value
Home Financials for this Owner
Home Financials are based on the most recent Mortgage that was taken out on this home.
Original Mortgage
$190,000
Outstanding Balance
$101,616
Interest Rate
3.96%
Mortgage Type
New Conventional
Estimated Equity
$402,924
Purchase Details
Closed on
Jun 28, 1996
Sold by
Gracie Scott A and Gracie Roseann
Bought by
Lanier Nathan
Home Financials for this Owner
Home Financials are based on the most recent Mortgage that was taken out on this home.
Original Mortgage
$121,417
Interest Rate
8.1%
Mortgage Type
FHA
Purchase Details
Closed on
Dec 24, 1984
Bought by
Lanier Nathan and Lanier Tracy R
Purchase Details
Closed on
Nov 27, 1974
Bought by
Lanier Nathan and Lanier Tracy R
Create a Home Valuation Report for This Property
The Home Valuation Report is an in-depth analysis detailing your home's value as well as a comparison with similar homes in the area
Home Values in the Area
Average Home Value in this Area
Purchase History
| Date | Buyer | Sale Price | Title Company |
|---|---|---|---|
| Lanier Nathan | -- | Heritage Title Co | |
| Lanier Nathan | $122,500 | -- | |
| Lanier Nathan | $63,000 | -- | |
| Lanier Nathan | $29,200 | -- |
Source: Public Records
Mortgage History
| Date | Status | Borrower | Loan Amount |
|---|---|---|---|
| Open | Lanier Nathan | $190,000 | |
| Closed | Lanier Nathan | $121,417 |
Source: Public Records
Tax History Compared to Growth
Tax History
| Year | Tax Paid | Tax Assessment Tax Assessment Total Assessment is a certain percentage of the fair market value that is determined by local assessors to be the total taxable value of land and additions on the property. | Land | Improvement |
|---|---|---|---|---|
| 2025 | $2,054 | $29,257 | $10,394 | $18,863 |
| 2024 | $2,054 | $29,257 | $10,394 | $18,863 |
| 2023 | $2,026 | $28,174 | $11,484 | $20,375 |
| 2022 | $2,265 | $22,886 | $8,562 | $14,324 |
| 2021 | $2,294 | $23,545 | $8,809 | $14,736 |
| 2020 | $1,979 | $20,371 | $7,794 | $12,577 |
| 2019 | $1,948 | $20,371 | $7,794 | $12,577 |
| 2018 | $1,684 | $17,726 | $7,704 | $10,022 |
| 2017 | $1,661 | $19,597 | $8,517 | $11,080 |
| 2016 | $1,553 | $16,247 | $7,005 | $9,242 |
| 2015 | $1,480 | $13,532 | $4,298 | $9,234 |
| 2014 | $1,264 | $13,532 | $4,298 | $9,234 |
Source: Public Records
Map
Nearby Homes
- 845 Martin St
- 1211 Meadow St
- 107 Caribou Place
- 1226 Atwood St
- 727 Baker St
- 342 9th Ave
- 823 Collyer St
- 641 Martin St
- 836 Emery St
- 830 Emery St
- 225 E 8th Ave Unit A2
- 225 E 8th Ave Unit E10
- 936 Kimbark St Unit 4
- 1147 Emery St
- 10 Juneau Place
- 146 E Saint Clair Ave Unit 148
- 820 Kimbark St Unit D
- 884 Elliott St
- 643 Collyer St
- 736 Kimbark St
- 50 Spring Dale Place
- 53 Spring Dale Place
- 25 Placer Ave
- 31 Placer Ave
- 56 Spring Dale Place
- 55 Spring Dale Place
- 37 Placer Ave
- 13 Placer Ave
- 57 Spring Dale Place
- 62 Spring Dale Place
- 43 Placer Ave
- 63 Spring Dale Place
- 49 Placer Ave
- 68 Spring Dale Place
- 7 Placer Ave
- 69 Spring Dale Place
- 55 Placer Ave
- 24 Placer Ave
- 30 Placer Ave
- 102 Granada Ct