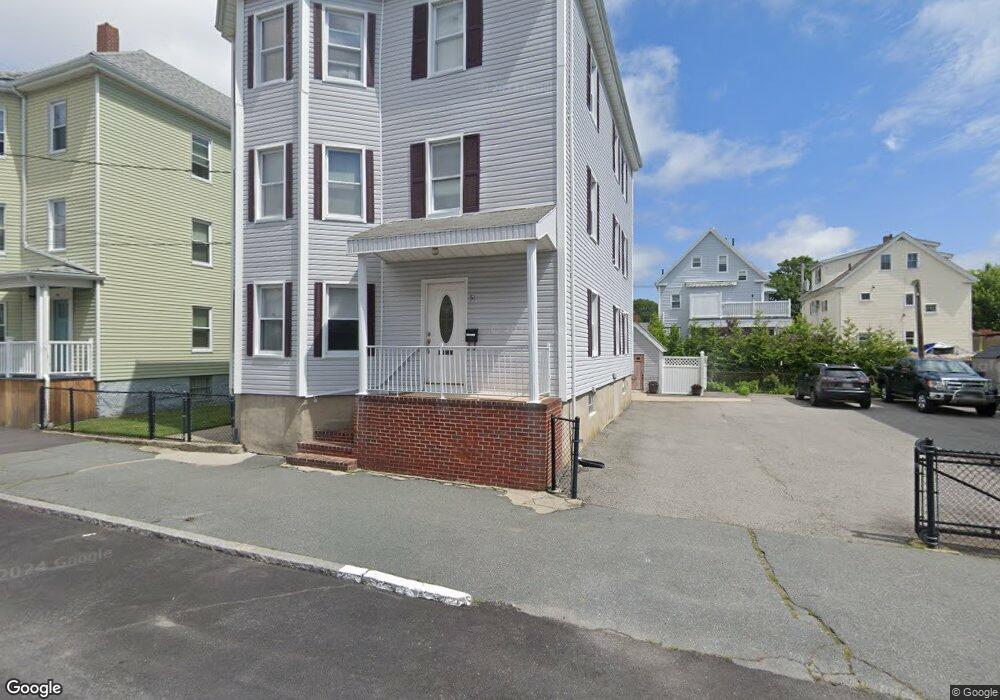
51 Swift St New Bedford, MA 02740
The South End NeighborhoodEstimated Value: $617,000 - $630,000
6
Beds
3
Baths
3,201
Sq Ft
$194/Sq Ft
Est. Value
About This Home
This home is located at 51 Swift St, New Bedford, MA 02740 and is currently estimated at $622,333, approximately $194 per square foot. 51 Swift St is a home located in Bristol County with nearby schools including John B. DeValles Elementary School, Roosevelt Middle School, and New Bedford High School.
Ownership History
Date
Name
Owned For
Owner Type
Purchase Details
Closed on
Jul 28, 2009
Sold by
Dutra Eduino G
Bought by
Madeira Jose R
Current Estimated Value
Home Financials for this Owner
Home Financials are based on the most recent Mortgage that was taken out on this home.
Original Mortgage
$119,861
Outstanding Balance
$79,612
Interest Rate
5.58%
Mortgage Type
Purchase Money Mortgage
Estimated Equity
$542,721
Purchase Details
Closed on
Nov 16, 1998
Sold by
Fleet Mtg Corp
Bought by
Dutra Eduino G
Purchase Details
Closed on
May 16, 1998
Sold by
Rapoza Manuel and Fleet Mortgage Corp
Bought by
Fleet National Bank
Purchase Details
Closed on
Jan 19, 1989
Sold by
Langenin F A
Bought by
Rapoza Manual
Create a Home Valuation Report for This Property
The Home Valuation Report is an in-depth analysis detailing your home's value as well as a comparison with similar homes in the area
Home Values in the Area
Average Home Value in this Area
Purchase History
| Date | Buyer | Sale Price | Title Company |
|---|---|---|---|
| Madeira Jose R | $124,000 | -- | |
| Madeira Jose R | $124,000 | -- | |
| Dutra Eduino G | $72,000 | -- | |
| Dutra Eduino G | $72,000 | -- | |
| Fleet National Bank | $55,000 | -- | |
| Fleet National Bank | $55,000 | -- | |
| Rapoza Manual | $150,000 | -- |
Source: Public Records
Mortgage History
| Date | Status | Borrower | Loan Amount |
|---|---|---|---|
| Open | Rapoza Manual | $119,861 | |
| Closed | Rapoza Manual | $119,861 | |
| Previous Owner | Rapoza Manual | $75,000 |
Source: Public Records
Tax History Compared to Growth
Tax History
| Year | Tax Paid | Tax Assessment Tax Assessment Total Assessment is a certain percentage of the fair market value that is determined by local assessors to be the total taxable value of land and additions on the property. | Land | Improvement |
|---|---|---|---|---|
| 2025 | $5,557 | $491,300 | $101,300 | $390,000 |
| 2024 | $5,034 | $419,500 | $97,700 | $321,800 |
| 2023 | $4,561 | $319,200 | $81,800 | $237,400 |
| 2022 | $4,216 | $271,300 | $79,600 | $191,700 |
| 2021 | $4,067 | $260,900 | $76,000 | $184,900 |
| 2020 | $4,058 | $251,100 | $76,000 | $175,100 |
| 2019 | $3,541 | $215,000 | $76,000 | $139,000 |
| 2018 | $3,384 | $203,500 | $76,000 | $127,500 |
| 2017 | $3,183 | $190,700 | $77,800 | $112,900 |
| 2016 | $3,061 | $185,600 | $77,800 | $107,800 |
| 2015 | $2,861 | $181,900 | $77,800 | $104,100 |
| 2014 | $2,758 | $181,900 | $77,800 | $104,100 |
Source: Public Records
Map
Nearby Homes