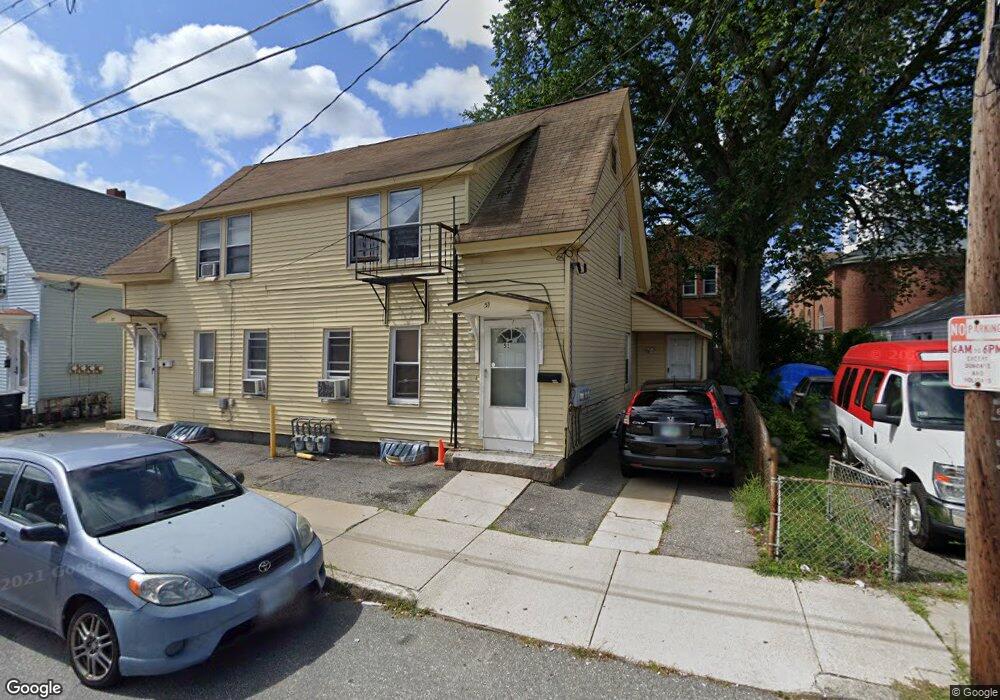
51 Vine St Unit 53 Nashua, NH 03060
Mine Falls Park NeighborhoodEstimated Value: $565,000 - $637,000
5
Beds
3
Baths
2,460
Sq Ft
$241/Sq Ft
Est. Value
About This Home
This home is located at 51 Vine St Unit 53, Nashua, NH 03060 and is currently estimated at $593,000, approximately $241 per square foot. 51 Vine St Unit 53 is a home located in Hillsborough County with nearby schools including Ledge Street Elementary School, Elm Street Middle School, and Nashua High School South.
Ownership History
Date
Name
Owned For
Owner Type
Purchase Details
Closed on
Jul 11, 2022
Sold by
Almonte Junior A and Almonte Marleny L
Bought by
Almonte Junior A and Dealmonte Marleny L
Current Estimated Value
Home Financials for this Owner
Home Financials are based on the most recent Mortgage that was taken out on this home.
Original Mortgage
$295,075
Outstanding Balance
$280,730
Interest Rate
5.09%
Mortgage Type
FHA
Estimated Equity
$312,270
Purchase Details
Closed on
Oct 5, 2010
Sold by
Fhlmc
Bought by
Almonte Junior A
Home Financials for this Owner
Home Financials are based on the most recent Mortgage that was taken out on this home.
Original Mortgage
$128,272
Interest Rate
4.44%
Mortgage Type
Purchase Money Mortgage
Purchase Details
Closed on
Jun 14, 2010
Sold by
Ganapathy Boppanda and Ganapathy Fhlmc
Bought by
Fhlmc
Purchase Details
Closed on
Jan 30, 2007
Sold by
Marcel Ouellet T and Marcel Catherine Ouellet
Bought by
Ganapathy Boppanda
Purchase Details
Closed on
Feb 20, 2002
Sold by
Gobeil Claude and Gobeil Muguette
Bought by
Ouellet Catherine and Ouellet Marcel
Create a Home Valuation Report for This Property
The Home Valuation Report is an in-depth analysis detailing your home's value as well as a comparison with similar homes in the area
Home Values in the Area
Average Home Value in this Area
Purchase History
| Date | Buyer | Sale Price | Title Company |
|---|---|---|---|
| Almonte Junior A | -- | None Available | |
| Almonte Junior A | -- | None Available | |
| Almonte Junior A | $130,000 | -- | |
| Almonte Junior A | $130,000 | -- | |
| Fhlmc | $199,600 | -- | |
| Fhlmc | $199,600 | -- | |
| Ganapathy Boppanda | $260,000 | -- | |
| Ganapathy Boppanda | $260,000 | -- | |
| Ouellet Catherine | $26,000 | -- | |
| Ouellet Catherine | $26,000 | -- |
Source: Public Records
Mortgage History
| Date | Status | Borrower | Loan Amount |
|---|---|---|---|
| Open | Almonte Junior A | $295,075 | |
| Closed | Almonte Junior A | $295,075 | |
| Previous Owner | Ouellet Catherine | $128,272 |
Source: Public Records
Tax History Compared to Growth
Tax History
| Year | Tax Paid | Tax Assessment Tax Assessment Total Assessment is a certain percentage of the fair market value that is determined by local assessors to be the total taxable value of land and additions on the property. | Land | Improvement |
|---|---|---|---|---|
| 2024 | $7,430 | $467,300 | $125,400 | $341,900 |
| 2023 | $7,243 | $397,300 | $100,300 | $297,000 |
| 2022 | $7,179 | $397,300 | $100,300 | $297,000 |
| 2021 | $5,858 | $252,300 | $63,500 | $188,800 |
| 2020 | $5,705 | $252,300 | $63,500 | $188,800 |
| 2019 | $5,490 | $252,300 | $63,500 | $188,800 |
| 2018 | $5,351 | $252,300 | $63,500 | $188,800 |
| 2017 | $4,467 | $173,200 | $58,800 | $114,400 |
| 2016 | $4,342 | $173,200 | $58,800 | $114,400 |
| 2015 | $4,249 | $173,200 | $58,800 | $114,400 |
| 2014 | -- | $173,200 | $58,800 | $114,400 |
Source: Public Records
Map
Nearby Homes
- 71 Vine St Unit 713/4
- 38 Central St
- 8 Buck St Unit 10
- 30 Ledge St
- 29 Wilder St
- 4 Badger St
- 121 Palm St
- 24 E Otterson St
- 52 Main St Unit 402
- 169A W Hollis St Unit 193
- 32-34 Grand Ave
- 19.5 Balcom St
- 16-18 Perry Ave
- 15 Lovell St Unit 20
- 15 Lovell St Unit 3
- 15 Lovell St Unit 10
- 3 1/2 Beacon Ct
- 2 Hillcrest Ave
- 6 Lake Ave
- 7 Bitirnas St Unit U7