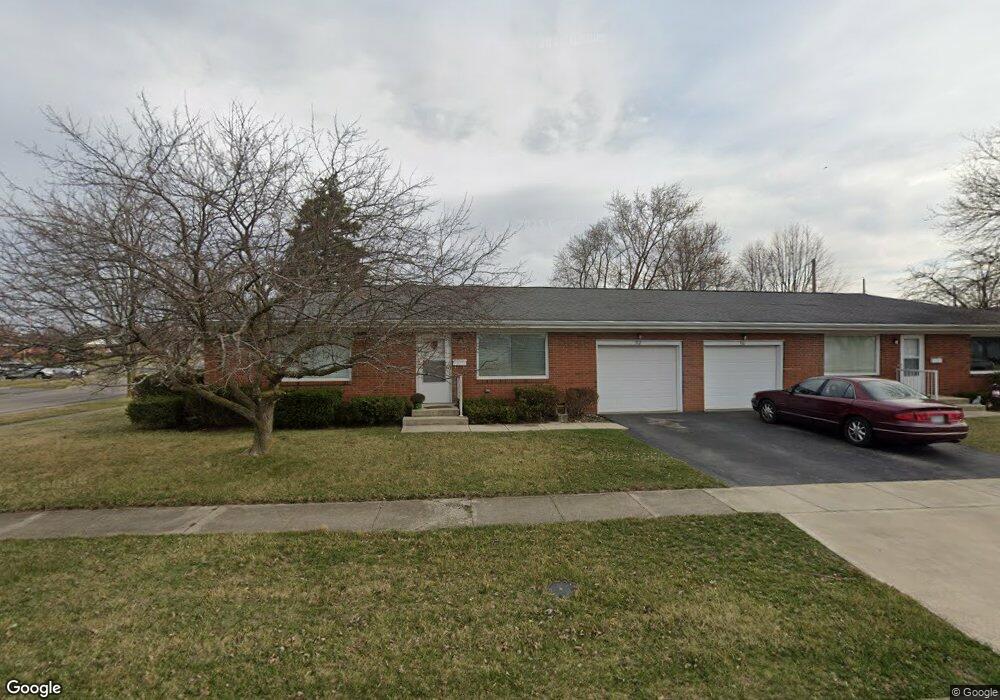
510 - 512 Sheffield Dr Findlay, OH 45840
Estimated Value: $199,000 - $243,675
4
Beds
2
Baths
1,863
Sq Ft
$119/Sq Ft
Est. Value
About This Home
This home is located at 510 - 512 Sheffield Dr, Findlay, OH 45840 and is currently estimated at $222,419, approximately $119 per square foot. 510 - 512 Sheffield Dr is a home located in Hancock County with nearby schools including Bigelow Hill Elementary School, Northview Elementary School, and Glenwood Middle School.
Ownership History
Date
Name
Owned For
Owner Type
Purchase Details
Closed on
Jul 29, 2025
Sold by
Drs Investment Properties Llc
Bought by
Wwbr Group Llc
Current Estimated Value
Purchase Details
Closed on
Jun 9, 2016
Sold by
Steinbauer Donald R
Bought by
Drs Investment Properties Llc
Purchase Details
Closed on
Mar 31, 2016
Bought by
D R S Investment Properties Llc
Home Financials for this Owner
Home Financials are based on the most recent Mortgage that was taken out on this home.
Interest Rate
3.71%
Purchase Details
Closed on
Sep 8, 2003
Sold by
Woodworth Truman M and Spieker Fred R
Bought by
Gibson Larry E and Gibson Joyce L
Home Financials for this Owner
Home Financials are based on the most recent Mortgage that was taken out on this home.
Original Mortgage
$109,200
Interest Rate
6.23%
Mortgage Type
Unknown
Purchase Details
Closed on
Apr 10, 1987
Bought by
Woodworth Truman M
Create a Home Valuation Report for This Property
The Home Valuation Report is an in-depth analysis detailing your home's value as well as a comparison with similar homes in the area
Home Values in the Area
Average Home Value in this Area
Purchase History
| Date | Buyer | Sale Price | Title Company |
|---|---|---|---|
| Wwbr Group Llc | $225,000 | Whitman Title | |
| Wwbr Group Llc | $225,000 | Whitman Title | |
| Drs Investment Properties Llc | -- | None Available | |
| D R S Investment Properties Llc | $145,000 | -- | |
| Gibson Larry E | $136,500 | West Ohio Title | |
| Woodworth Truman M | $68,000 | -- |
Source: Public Records
Mortgage History
| Date | Status | Borrower | Loan Amount |
|---|---|---|---|
| Previous Owner | D R S Investment Properties Llc | -- | |
| Previous Owner | Gibson Larry E | $109,200 |
Source: Public Records
Tax History Compared to Growth
Tax History
| Year | Tax Paid | Tax Assessment Tax Assessment Total Assessment is a certain percentage of the fair market value that is determined by local assessors to be the total taxable value of land and additions on the property. | Land | Improvement |
|---|---|---|---|---|
| 2024 | $1,707 | $46,840 | $6,490 | $40,350 |
| 2023 | $1,710 | $46,840 | $6,490 | $40,350 |
| 2022 | $1,712 | $46,840 | $6,490 | $40,350 |
| 2021 | $1,552 | $37,160 | $6,490 | $30,670 |
| 2020 | $1,552 | $37,160 | $6,490 | $30,670 |
| 2019 | $1,660 | $37,160 | $6,490 | $30,670 |
| 2018 | $1,607 | $33,540 | $5,400 | $28,140 |
| 2017 | $749 | $33,540 | $5,400 | $28,140 |
| 2016 | $1,484 | $33,540 | $5,400 | $28,140 |
| 2015 | $1,544 | $34,330 | $5,400 | $28,930 |
| 2014 | $1,544 | $34,330 | $5,400 | $28,930 |
| 2012 | $2,064 | $45,580 | $5,400 | $40,180 |
Source: Public Records
Map
Nearby Homes
- 506 Hillcrest Ave
- 615 Hillcrest Ave
- 126 Hillcrest Ave
- 3300 Crosshill Dr
- 128 Harrington Ave
- 933 Laurel Ln
- 643 Edith Ave
- 1310 Muirfield Dr
- 905 W Melrose Ave
- 232 Prentiss Ave
- 3239 N Main St
- 233 Bell Ave
- 1934 Geffs Ave
- 925 W Melrose Ave
- 304 Rector Ave
- 405 Clifton Ave
- 2100 Candlewick Dr
- 410 Monroe Ave
- 1820 N Main St
- 3315 Terrace Ln
- 2723 Greenacre Dr
- 500 Sheffield Dr
- 515 Sheffield Dr
- 509 Sheffield Dr
- 2727 Greenacre Dr
- 501 Sheffield Dr
- 518 Sheffield Dr
- 426 Sheffield Dr
- 521 Sheffield Dr
- 2726 Greenacre Dr
- 501 W Bigelow Ave
- 2707 Greenacre Dr
- 2731 Greenacre Dr
- 527 Sheffield Dr
- 2704 Eton Place
- 2730 Greenacre Dr
- 2713 Eton Place
- 427 W Bigelow Ave
- 530 Sheffield Dr
- 535 Sheffield Dr