
Seller's Agent in 2019
Kimberly Norman
Norman & Norman Realtors
(404) 759-1328
128 Total Sales

Estimated Value: $210,000 - $242,000
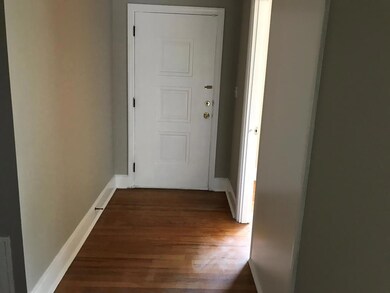
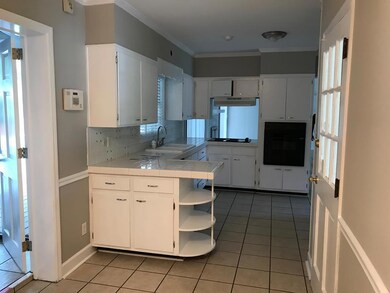
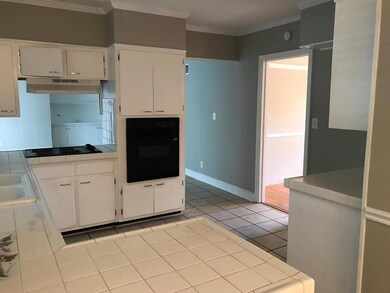
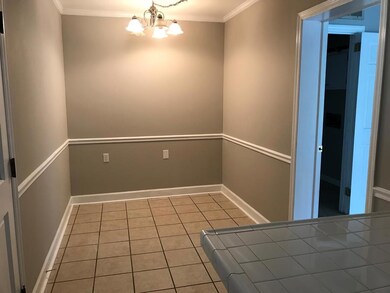
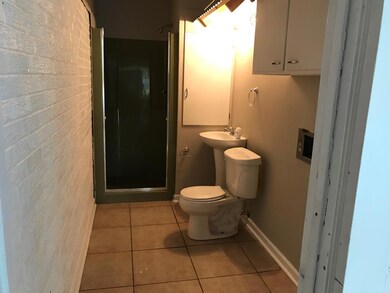
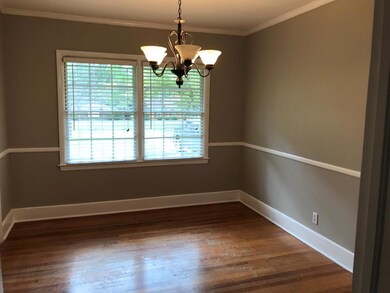
PRICE TO SELL! This Beautiful home in Northwest Albany with tons of square footage for a great price very close to all the restaurants and shopping. Featuring a beautifully landscaped yard. This home is perfect for all your entertaining with a large game room with sliding glass doors and wall of glass overlooking an in-ground pool. Back yard with a covered patio that allows you to interact with guests from the inside and outside. This home features exposed beam ceilings, and some hardwood floors. Large bedrooms with large closets and tons of storage. Some updating has been completed but will need a little TLC to complete your dream home. "Information deemed Reliable but not Guaranteed"
Last Agent to Sell the Property
Norman & Norman Realtors Brokerage Phone: 2294352787 License #179056 Listed on: 03/25/2019
Last Buyer's Agent
Norman & Norman Realtors Brokerage Phone: 2294352787 License #179056 Listed on: 03/25/2019
| Date | Buyer | Sale Price | Title Company |
|---|---|---|---|
| Conley Tia L | $113,000 | -- | |
| Suntrust Mtg Inc | -- | -- | |
| Federal National Mtg Associati | -- | -- | |
| Williamson Mark | $164,000 | -- | |
| Kirksey Ii William Joseph | $125,000 | -- | |
| Cecil W Youngblood | -- | -- |
| Date | Status | Borrower | Loan Amount |
|---|---|---|---|
| Open | Conley Tia L | $110,953 | |
| Previous Owner | Williamson Mark | $128,000 |
| Date | Event | Price | List to Sale | Price per Sq Ft |
|---|---|---|---|---|
| 05/02/2019 05/02/19 | Sold | $113,000 | -- | $46 / Sq Ft |
| 03/25/2019 03/25/19 | Pending | -- | -- | -- |
| Year | Tax Paid | Tax Assessment Tax Assessment Total Assessment is a certain percentage of the fair market value that is determined by local assessors to be the total taxable value of land and additions on the property. | Land | Improvement |
|---|---|---|---|---|
| 2024 | $2,534 | $55,120 | $8,480 | $46,640 |
| 2023 | $1,636 | $55,120 | $8,480 | $46,640 |
| 2022 | $2,484 | $55,120 | $8,480 | $46,640 |
| 2021 | $2,303 | $55,120 | $8,480 | $46,640 |
| 2020 | $1,964 | $55,120 | $8,480 | $46,640 |
| 2019 | $2,404 | $55,120 | $8,480 | $46,640 |
| 2018 | $2,327 | $55,120 | $8,480 | $46,640 |
| 2017 | $2,168 | $55,120 | $8,480 | $46,640 |
| 2016 | $2,169 | $55,120 | $8,480 | $46,640 |
| 2015 | $2,175 | $55,120 | $8,480 | $46,640 |
| 2014 | $2,148 | $55,120 | $8,480 | $46,640 |
Seller's Agent in 2019
Kimberly Norman
Norman & Norman Realtors
(404) 759-1328
128 Total Sales
Source: Albany Board of REALTORS®
MLS Number: 141321
APN: 000GG-00022-004