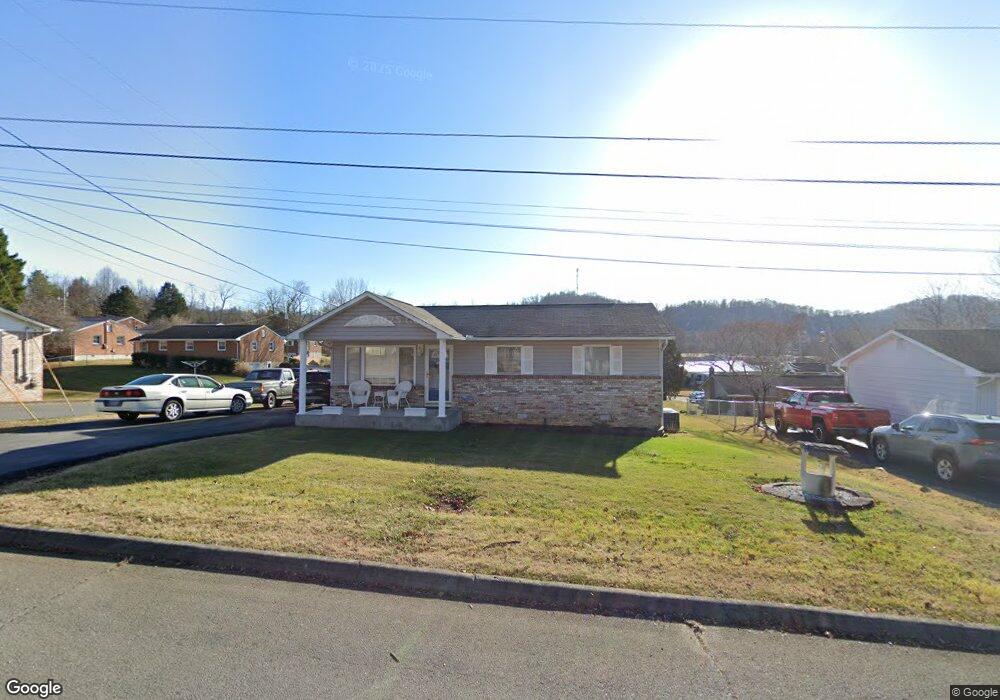
510 Bradley St Elizabethton, TN 37643
Estimated Value: $138,023 - $219,000
3
Beds
1
Bath
912
Sq Ft
$189/Sq Ft
Est. Value
About This Home
This home is located at 510 Bradley St, Elizabethton, TN 37643 and is currently estimated at $172,506, approximately $189 per square foot. 510 Bradley St is a home located in Carter County with nearby schools including Elizabethton High School and East Tn Christian Home & Academy.
Ownership History
Date
Name
Owned For
Owner Type
Purchase Details
Closed on
Oct 6, 2003
Sold by
Holtsclaw Earlene H
Bought by
Hodge Johnette
Current Estimated Value
Home Financials for this Owner
Home Financials are based on the most recent Mortgage that was taken out on this home.
Original Mortgage
$46,400
Interest Rate
6.32%
Purchase Details
Closed on
Feb 16, 1994
Sold by
Hilman Martha B
Bought by
Holtsclaw Earlene
Purchase Details
Closed on
Nov 21, 1968
Bought by
Hilman Martha B
Create a Home Valuation Report for This Property
The Home Valuation Report is an in-depth analysis detailing your home's value as well as a comparison with similar homes in the area
Home Values in the Area
Average Home Value in this Area
Purchase History
| Date | Buyer | Sale Price | Title Company |
|---|---|---|---|
| Hodge Johnette | $58,000 | -- | |
| Holtsclaw Earlene | -- | -- | |
| Hilman Martha B | -- | -- |
Source: Public Records
Mortgage History
| Date | Status | Borrower | Loan Amount |
|---|---|---|---|
| Closed | Hilman Martha B | $46,400 |
Source: Public Records
Tax History Compared to Growth
Tax History
| Year | Tax Paid | Tax Assessment Tax Assessment Total Assessment is a certain percentage of the fair market value that is determined by local assessors to be the total taxable value of land and additions on the property. | Land | Improvement |
|---|---|---|---|---|
| 2024 | $678 | $20,525 | $3,750 | $16,775 |
| 2023 | $678 | $20,525 | $0 | $0 |
| 2022 | $739 | $20,525 | $3,750 | $16,775 |
| 2021 | $417 | $20,525 | $3,750 | $16,775 |
| 2020 | $721 | $20,525 | $3,750 | $16,775 |
| 2019 | $721 | $16,700 | $2,600 | $14,100 |
| 2018 | $711 | $16,700 | $2,600 | $14,100 |
| 2017 | $731 | $16,700 | $2,600 | $14,100 |
| 2016 | $727 | $17,150 | $2,600 | $14,550 |
| 2015 | $729 | $17,150 | $2,600 | $14,550 |
| 2014 | $734 | $17,200 | $2,575 | $14,625 |
Source: Public Records
Map
Nearby Homes