A
Seller's Agent in 2024
Anthony Saviano
Albert Realty Inc., REALTORS
(401) 641-0342
1 in this area
11 Total Sales
Estimated Value: $162,598 - $232,000
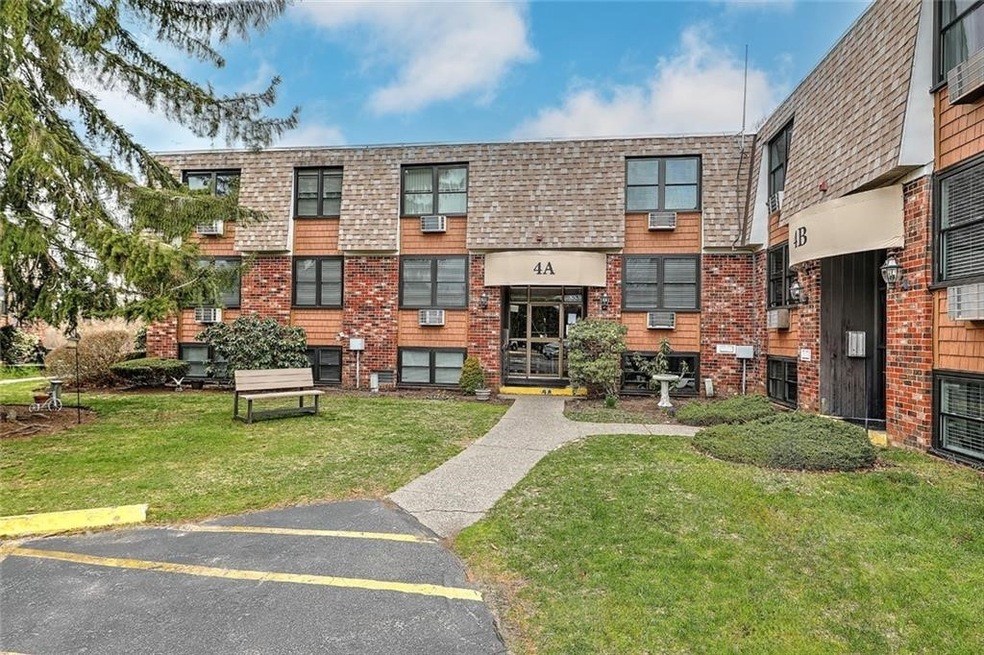
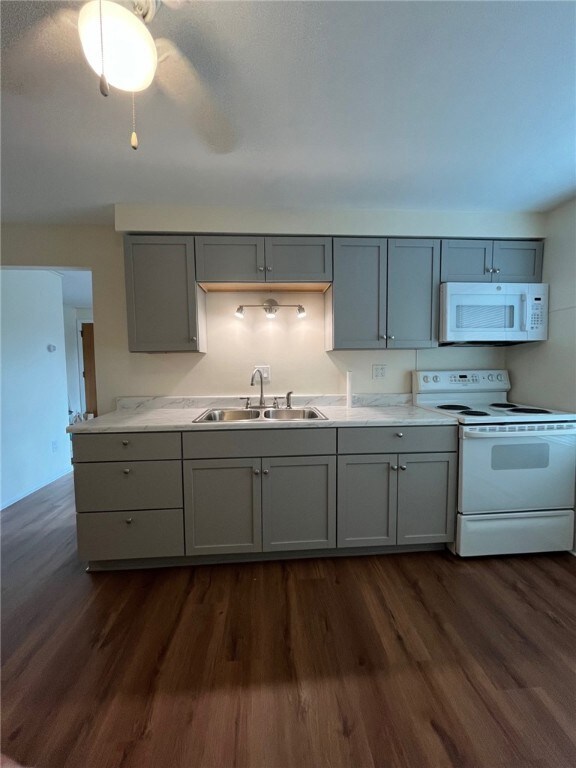
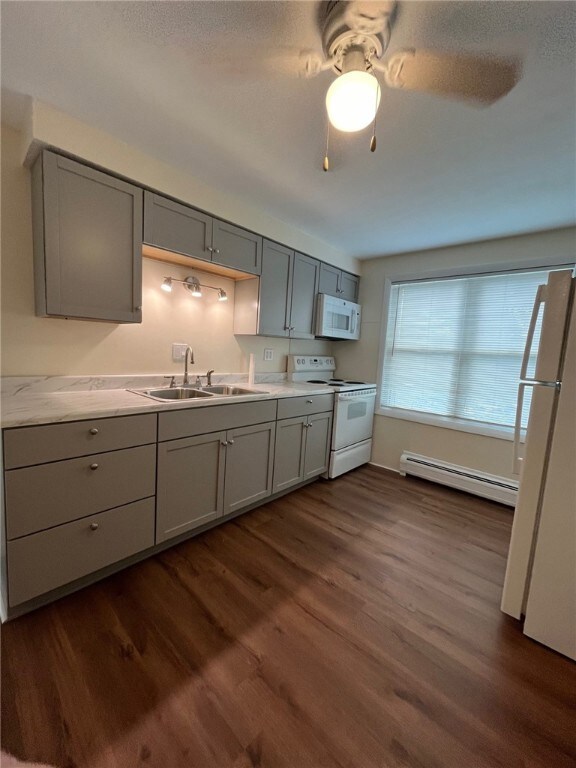
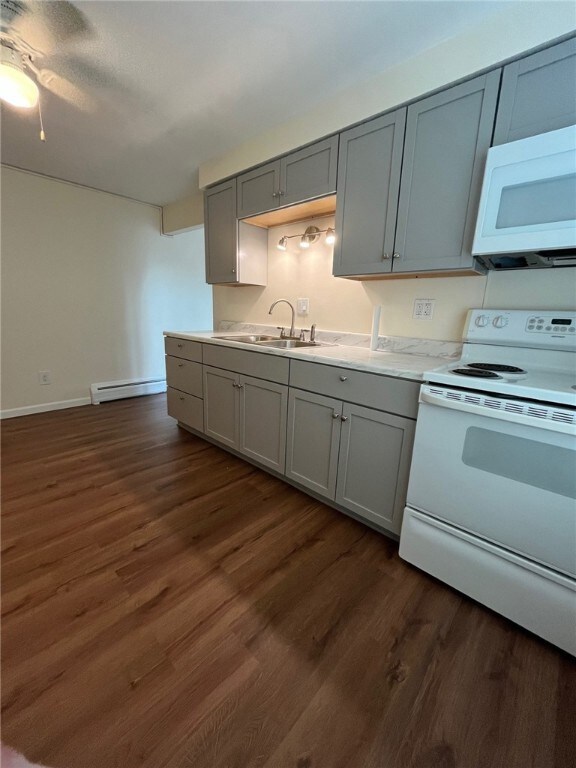
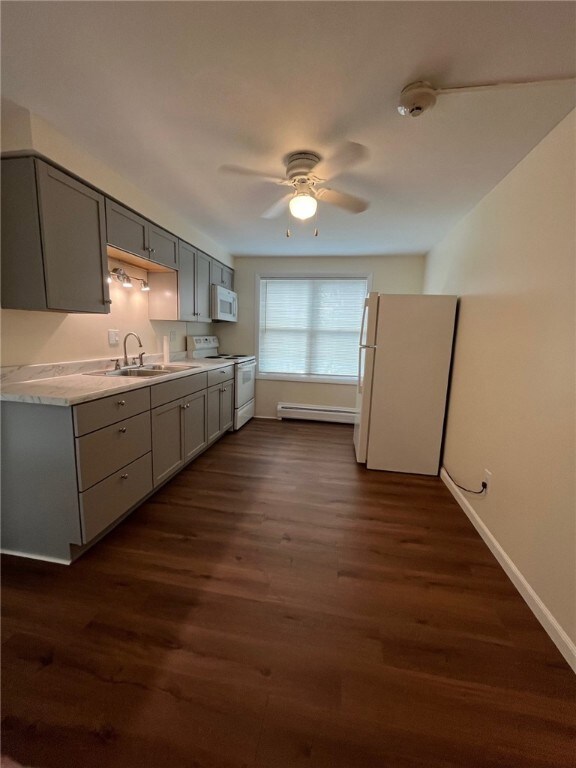
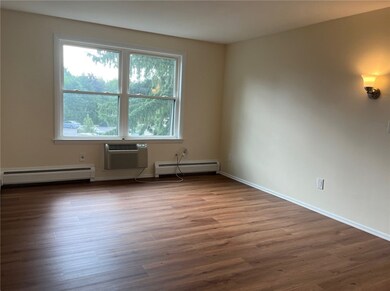
Bright and spacious renovated condo which includes heat and water in the rental price. Double windows flood the rooms with natural light, large bedroom and living room with new kitchen highlighting the contemporary design. Step outside to discover well-maintained grounds with 2 assigned parking space. Laundry in building. Close to 195 and only 20 minutes to Providence. This condo offers a blend of style and convenience that's hard to beat.
Last Agent to Rent the Property
Century 21 Topsail Realty License #RES.0024121 Listed on: 09/20/2024

Last Renter's Agent
Century 21 Topsail Realty License #RES.0024121 Listed on: 09/20/2024
| Date | Buyer | Sale Price | Title Company |
|---|---|---|---|
| Chilton Roma Rlty Llc | $161,000 | None Available | |
| Chilton Roma Rlty Llc | $161,000 | None Available |
| Date | Event | Price | List to Sale | Price per Sq Ft | Prior Sale |
|---|---|---|---|---|---|
| 11/04/2024 11/04/24 | Rented | $1,650 | 0.0% | -- | |
| 10/28/2024 10/28/24 | Under Contract | -- | -- | -- | |
| 10/12/2024 10/12/24 | Price Changed | $1,650 | -8.3% | $3 / Sq Ft | |
| 09/20/2024 09/20/24 | For Rent | $1,800 | 0.0% | -- | |
| 05/10/2024 05/10/24 | Sold | $161,000 | +3.7% | $251 / Sq Ft | View Prior Sale |
| 04/05/2024 04/05/24 | Pending | -- | -- | -- | |
| 04/03/2024 04/03/24 | For Sale | $155,300 | -- | $242 / Sq Ft |
| Year | Tax Paid | Tax Assessment Tax Assessment Total Assessment is a certain percentage of the fair market value that is determined by local assessors to be the total taxable value of land and additions on the property. | Land | Improvement |
|---|---|---|---|---|
| 2025 | $2,312 | $155,300 | $0 | $155,300 |
| 2024 | $2,243 | $155,300 | $0 | $155,300 |
| 2023 | $2,121 | $155,300 | $0 | $155,300 |
| 2022 | $2,073 | $115,100 | $0 | $115,100 |
| 2021 | $2,040 | $115,100 | $0 | $115,100 |
| 2020 | $1,998 | $115,100 | $0 | $115,100 |
| 2019 | $1,724 | $90,200 | $0 | $90,200 |
| 2018 | $1,701 | $90,200 | $0 | $90,200 |
| 2017 | $1,697 | $90,200 | $0 | $90,200 |
| 2016 | $1,783 | $89,300 | $0 | $89,300 |
| 2015 | $1,783 | $89,300 | $0 | $89,300 |
| 2014 | $1,792 | $89,300 | $0 | $89,300 |
A
Seller's Agent in 2024
Anthony Saviano
Albert Realty Inc., REALTORS
(401) 641-0342
1 in this area
11 Total Sales
Landlord's Agent in 2024
Mary Jo Tavares
Century 21 Topsail Realty
(401) 297-1399
1 in this area
51 Total Sales
Source: State-Wide MLS
MLS Number: 1369150
APN: WARR-000020-000000-000455
Disclaimer: Certain information contained herein is derived from information provided by parties other than Homes.com. All information provided is deemed reliable, but is not guaranteed to be accurate and should be independently verified.
![]() IDX information is provided exclusively for personal, non-commercial use, and may not be used for any purpose other than to identify prospective properties consumers may be interested in purchasing. Information is deemed reliable but not guaranteed.
IDX information is provided exclusively for personal, non-commercial use, and may not be used for any purpose other than to identify prospective properties consumers may be interested in purchasing. Information is deemed reliable but not guaranteed.
Copyright © 2025 State-Wide MLS, Inc. All rights reserved.