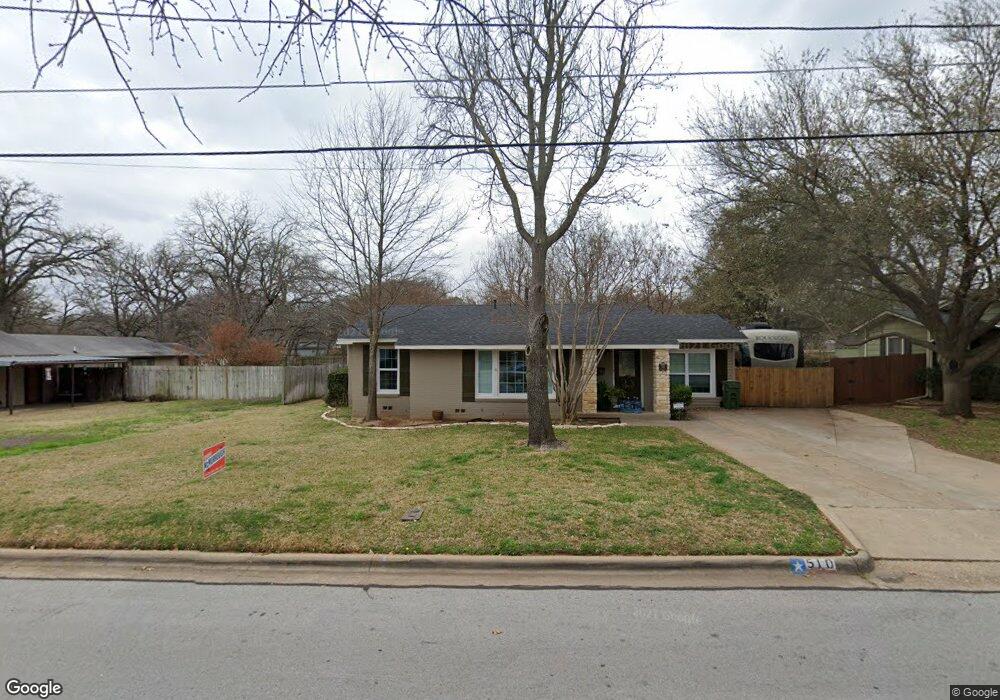
510 Elliott St Arlington, TX 76013
Downtown Arlington NeighborhoodEstimated Value: $322,000 - $379,000
3
Beds
2
Baths
2,019
Sq Ft
$175/Sq Ft
Est. Value
About This Home
This home is located at 510 Elliott St, Arlington, TX 76013 and is currently estimated at $352,898, approximately $174 per square foot. 510 Elliott St is a home located in Tarrant County with nearby schools including Swift Elementary School, Bailey Jr. High School, and Arlington High School.
Ownership History
Date
Name
Owned For
Owner Type
Purchase Details
Closed on
Feb 27, 2006
Sold by
Robertson Gary B and Robertson Melanie
Bought by
Mcdaniel Richard K and Mcdaniel Mary A
Current Estimated Value
Home Financials for this Owner
Home Financials are based on the most recent Mortgage that was taken out on this home.
Original Mortgage
$117,520
Outstanding Balance
$70,573
Interest Rate
7.25%
Mortgage Type
Fannie Mae Freddie Mac
Estimated Equity
$282,325
Purchase Details
Closed on
Mar 15, 2000
Sold by
Robertson Gina Raquel
Bought by
Robertson Gary Blain
Purchase Details
Closed on
Apr 1, 1996
Sold by
Raby Lester Gina R and Robertson Gina R
Bought by
Robertson Gary B
Purchase Details
Closed on
Jun 15, 1995
Sold by
Nicol Todd D and Nicol Kyndal D
Bought by
Raby Lester Gina R
Home Financials for this Owner
Home Financials are based on the most recent Mortgage that was taken out on this home.
Original Mortgage
$64,724
Interest Rate
8.17%
Create a Home Valuation Report for This Property
The Home Valuation Report is an in-depth analysis detailing your home's value as well as a comparison with similar homes in the area
Home Values in the Area
Average Home Value in this Area
Purchase History
| Date | Buyer | Sale Price | Title Company |
|---|---|---|---|
| Mcdaniel Richard K | -- | First American Title | |
| Robertson Gary Blain | -- | -- | |
| Robertson Gary B | -- | -- | |
| Raby Lester Gina R | -- | American Title Company |
Source: Public Records
Mortgage History
| Date | Status | Borrower | Loan Amount |
|---|---|---|---|
| Open | Mcdaniel Richard K | $117,520 | |
| Previous Owner | Raby Lester Gina R | $64,724 |
Source: Public Records
Tax History Compared to Growth
Tax History
| Year | Tax Paid | Tax Assessment Tax Assessment Total Assessment is a certain percentage of the fair market value that is determined by local assessors to be the total taxable value of land and additions on the property. | Land | Improvement |
|---|---|---|---|---|
| 2025 | $4,948 | $394,549 | $81,512 | $313,037 |
| 2024 | $4,948 | $394,549 | $81,512 | $313,037 |
| 2023 | $6,101 | $396,315 | $71,512 | $324,803 |
| 2022 | $6,251 | $272,454 | $51,461 | $220,993 |
| 2021 | $5,937 | $247,540 | $35,976 | $211,564 |
| 2020 | $5,216 | $238,187 | $35,976 | $202,211 |
| 2019 | $4,906 | $226,051 | $37,500 | $188,551 |
| 2018 | $3,900 | $171,665 | $25,000 | $146,665 |
| 2017 | $4,154 | $181,295 | $25,000 | $156,295 |
| 2016 | $3,776 | $141,872 | $25,000 | $116,872 |
| 2015 | $2,846 | $159,700 | $25,000 | $134,700 |
| 2014 | $2,846 | $159,700 | $25,000 | $134,700 |
Source: Public Records
Map
Nearby Homes
- 105 Paxton Cir
- 505 Dorcas Ln
- 109 Paxton Cir
- 317 Elliott St
- 311 Elliott St
- 307 Elliott St
- 149 Paxton Cir
- 303 Elliott St
- 145 Parkwood Ave
- 152 Paxton Cir
- 1509 University Dr
- 1512 White Way Dr
- 410 Westview Terrace
- 1815 Wellington Ct
- 1730 Justin Lyn St
- 1719 Crest Grove Dr
- 1712 Crest Point Dr
- 1732 Crest Point Dr
- 1901 Easy St
- 810 Arthur Dr
- 508 Elliott St
- 512 Elliott St
- 1511 W 2nd St
- 504 Elliott St
- 1401 W 2nd St
- 507 Elliott St
- 503 Elliott St
- 1324 Barnes Dr
- 502 Elliott St
- 1320 Barnes Dr
- 507 Dorcas Ln
- 416 Elliott St
- 1601 W 2nd St
- 1316 Barnes Dr
- 1313 W 2nd St
- 1502 W 2nd St
- 1502 W 2nd St Unit 38152399
- 1502 W 2nd St Unit 38152380
- 1502 W 2nd St Unit 38152352
- 1502 W 2nd St Unit 37478068