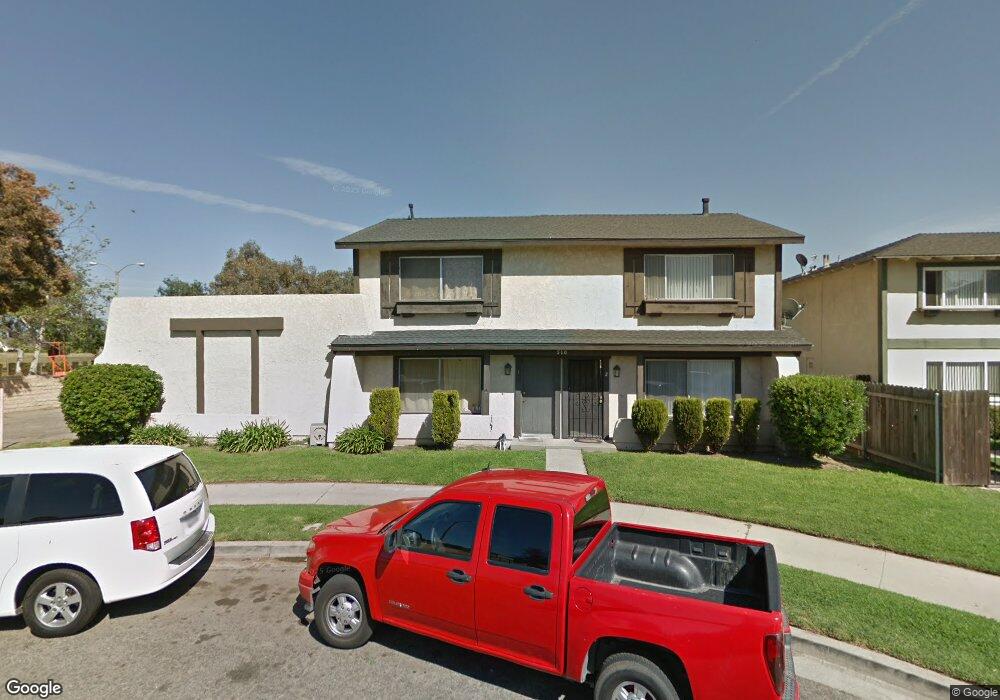
510 J Ct Unit 1 Oxnard, CA 93030
Hobson Park West NeighborhoodEstimated Value: $705,000 - $930,000
2
Beds
2
Baths
1,000
Sq Ft
$806/Sq Ft
Est. Value
About This Home
This home is located at 510 J Ct Unit 1, Oxnard, CA 93030 and is currently estimated at $806,487, approximately $806 per square foot. 510 J Ct Unit 1 is a home located in Ventura County with nearby schools including Driffill Elementary School, Pacifica High School, and Vista Real Charter High School.
Ownership History
Date
Name
Owned For
Owner Type
Purchase Details
Closed on
Jun 25, 2013
Sold by
Leyva Lorena
Bought by
Leyva Lorena and The Lorena Lyva Trust
Current Estimated Value
Purchase Details
Closed on
Nov 3, 2010
Sold by
Ramirez Yovany
Bought by
Leyva Lorena
Purchase Details
Closed on
Apr 19, 2010
Sold by
Ramirez Yovani
Bought by
Ramirez Yovani and Leyva Lorena
Purchase Details
Closed on
Jan 15, 2010
Sold by
Gierut Ralph M
Bought by
Ramirez Yovani
Home Financials for this Owner
Home Financials are based on the most recent Mortgage that was taken out on this home.
Original Mortgage
$220,000
Interest Rate
4.97%
Mortgage Type
New Conventional
Create a Home Valuation Report for This Property
The Home Valuation Report is an in-depth analysis detailing your home's value as well as a comparison with similar homes in the area
Home Values in the Area
Average Home Value in this Area
Purchase History
| Date | Buyer | Sale Price | Title Company |
|---|---|---|---|
| Leyva Lorena | -- | None Available | |
| Leyva Lorena | -- | None Available | |
| Ramirez Yovani | -- | None Available | |
| Ramirez Yovani | $275,000 | Chicago Title Company |
Source: Public Records
Mortgage History
| Date | Status | Borrower | Loan Amount |
|---|---|---|---|
| Previous Owner | Ramirez Yovani | $220,000 |
Source: Public Records
Tax History
| Year | Tax Paid | Tax Assessment Tax Assessment Total Assessment is a certain percentage of the fair market value that is determined by local assessors to be the total taxable value of land and additions on the property. | Land | Improvement |
|---|---|---|---|---|
| 2025 | $4,334 | $354,957 | $129,073 | $225,884 |
| 2024 | $4,334 | $347,998 | $126,543 | $221,455 |
| 2023 | $4,176 | $341,175 | $124,062 | $217,113 |
| 2022 | $4,051 | $334,486 | $121,630 | $212,856 |
| 2021 | $4,019 | $327,928 | $119,245 | $208,683 |
| 2020 | $4,094 | $324,568 | $118,023 | $206,545 |
| 2019 | $3,979 | $318,205 | $115,709 | $202,496 |
| 2018 | $3,924 | $311,967 | $113,441 | $198,526 |
| 2017 | $3,725 | $305,851 | $111,217 | $194,634 |
| 2016 | $3,595 | $299,855 | $109,037 | $190,818 |
| 2015 | $3,633 | $295,352 | $107,400 | $187,952 |
| 2014 | $3,594 | $289,569 | $105,298 | $184,271 |
Source: Public Records
Map
Nearby Homes
- 603 S G St
- 807 Kingfisher Way
- 550 S G St
- 1309 Nautical Way
- 1131 W 2nd St
- 1174 Oyster Place Unit 15
- 1150 W 1st St
- 1601 Lagoon Ln
- 816 Noontide Way
- 151 S F St
- 201 203 S E St
- 1030 Ilena St
- 307 N F St Unit 102
- 425 W 1st St
- 819 S B St Unit 34
- 865 S B St Unit Q1
- 462 N M St
- 1127 S C St
- 1127 Douglas Ave
- 940 Stern Ln
Your Personal Tour Guide
Ask me questions while you tour the home.