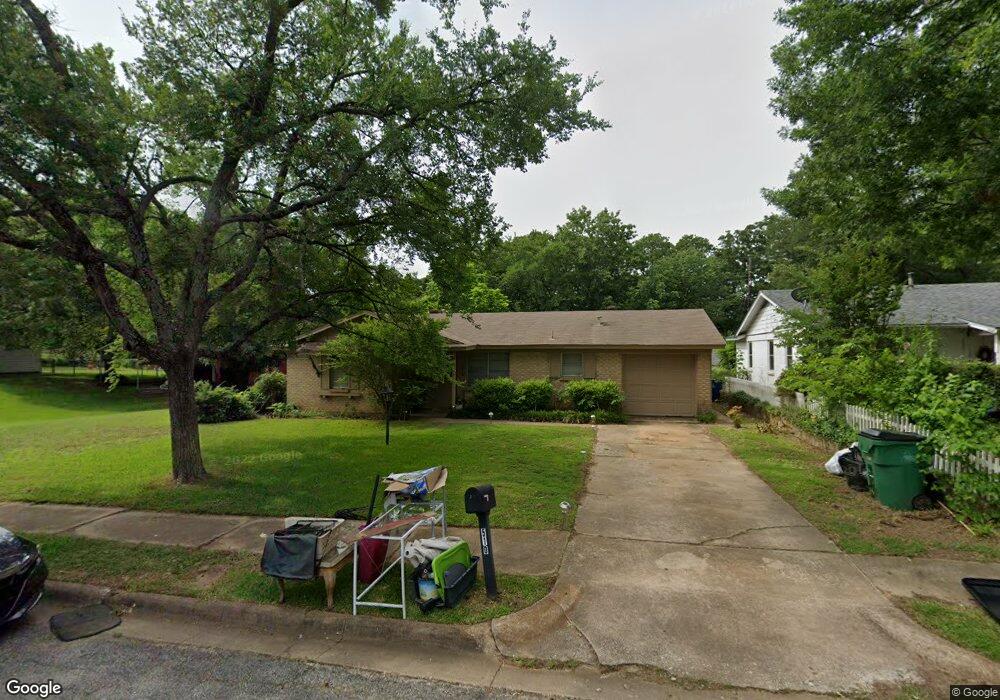
510 Joy Ln Denison, TX 75021
Estimated Value: $161,301 - $168,000
--
Bed
--
Bath
1,084
Sq Ft
$152/Sq Ft
Est. Value
About This Home
This home is located at 510 Joy Ln, Denison, TX 75021 and is currently estimated at $164,651, approximately $151 per square foot. 510 Joy Ln is a home located in Grayson County with nearby schools including Scott Middle School, Denison High School, and St. Luke's Parish Day School.
Ownership History
Date
Name
Owned For
Owner Type
Purchase Details
Closed on
Mar 11, 2020
Sold by
Rawlins Mr Randy
Bought by
Rawlins Mr Jonathan and Rawlins Molly
Current Estimated Value
Purchase Details
Closed on
Mar 5, 2007
Sold by
Hud
Bought by
Rawlins Richard Ray and Rawlins Susan Irene
Purchase Details
Closed on
Dec 12, 2006
Sold by
Wells Fargo Bank Na
Bought by
Hud
Purchase Details
Closed on
Dec 5, 2006
Sold by
Dunigan Dorothy Lee and Dunigan Robert Allen
Bought by
Not Provided
Purchase Details
Closed on
Jan 29, 2004
Sold by
Wilkinson Darrin and Wilkinson Charla
Bought by
Dunigan Robert Allen and Dunigan Dorothy Lee
Home Financials for this Owner
Home Financials are based on the most recent Mortgage that was taken out on this home.
Original Mortgage
$64,980
Interest Rate
5.79%
Mortgage Type
FHA
Create a Home Valuation Report for This Property
The Home Valuation Report is an in-depth analysis detailing your home's value as well as a comparison with similar homes in the area
Home Values in the Area
Average Home Value in this Area
Purchase History
| Date | Buyer | Sale Price | Title Company |
|---|---|---|---|
| Rawlins Mr Jonathan | -- | None Available | |
| Rawlins Richard Ray | -- | First American Title | |
| Hud | -- | None Available | |
| Not Provided | -- | None Available | |
| Dunigan Robert Allen | -- | -- |
Source: Public Records
Mortgage History
| Date | Status | Borrower | Loan Amount |
|---|---|---|---|
| Previous Owner | Dunigan Robert Allen | $64,980 |
Source: Public Records
Tax History Compared to Growth
Tax History
| Year | Tax Paid | Tax Assessment Tax Assessment Total Assessment is a certain percentage of the fair market value that is determined by local assessors to be the total taxable value of land and additions on the property. | Land | Improvement |
|---|---|---|---|---|
| 2025 | $2,918 | $129,915 | $44,505 | $85,410 |
| 2024 | $2,918 | $125,584 | $40,229 | $85,355 |
| 2023 | $2,766 | $122,069 | $40,229 | $81,840 |
| 2022 | $2,565 | $107,960 | $40,229 | $67,731 |
| 2021 | $2,282 | $90,498 | $20,315 | $70,183 |
| 2020 | $2,303 | $87,291 | $20,315 | $66,976 |
| 2019 | $2,269 | $82,453 | $14,301 | $68,152 |
| 2018 | $2,149 | $77,478 | $14,301 | $63,177 |
| 2017 | $1,735 | $62,000 | $14,301 | $47,699 |
| 2016 | $1,728 | $61,770 | $14,301 | $47,469 |
| 2015 | $1,301 | $46,061 | $3,586 | $42,475 |
| 2014 | $1,369 | $48,449 | $3,586 | $44,863 |
Source: Public Records
Map
Nearby Homes