517 Joy Ln Denison, TX 75021
Estimated Value: $184,000 - $187,376
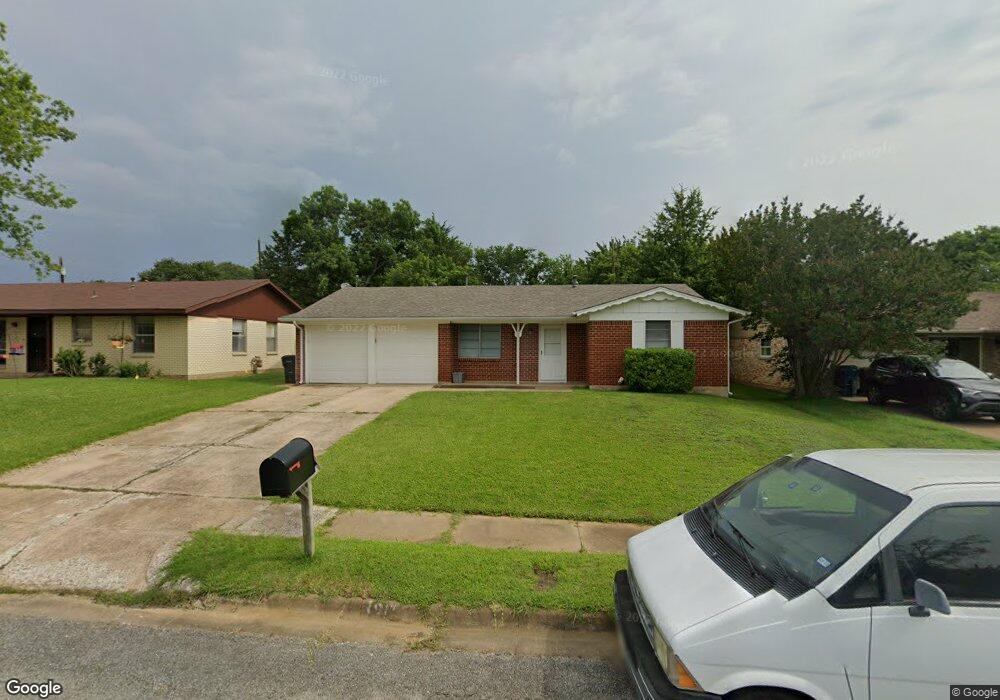
About This Home
This home is located at 517 Joy Ln, Denison, TX 75021 and is currently estimated at $185,688, approximately $155 per square foot. 517 Joy Ln is a home located in Grayson County with nearby schools including Scott Middle School, Denison High School, and St. Luke's Parish Day School.
Ownership History
We collect this data history from publicly available records. To have your information removed, we recommend requesting removal directly through your county’s website.
Purchase Details
Home Financials for this Owner
Home Financials are based on the most recent Mortgage that was taken out on this home.Home Values in the Area
Average Home Value in this Area
Purchase History
We collect this data history from publicly available records. To have your information removed, we recommend requesting removal directly through your county’s website.
| Date | Buyer | Sale Price | Title Company |
|---|---|---|---|
| -- | Red River Title Co |
Mortgage History
We collect this data history from publicly available records. To have your information removed, we recommend requesting removal directly through your county’s website.
| Date | Status | Borrower | Loan Amount |
|---|---|---|---|
| Open | $130,950 |
Tax History
We collect this data history from publicly available records. To have your information removed, we recommend requesting removal directly through your county’s website.
| Year | Tax Paid | Tax Assessment Tax Assessment Total Assessment is a certain percentage of the fair market value that is determined by local assessors to be the total taxable value of land and additions on the property. | Land | Improvement |
|---|---|---|---|---|
| 2025 | $2,824 | $193,037 | $38,976 | $154,061 |
| 2024 | $4,100 | $176,461 | $0 | $0 |
| 2023 | $2,365 | $160,419 | $0 | $0 |
| 2022 | $3,465 | $145,835 | $0 | $0 |
| 2021 | $3,344 | $132,577 | $16,212 | $116,365 |
| 2020 | $2,667 | $101,091 | $16,212 | $84,879 |
| 2019 | $2,705 | $98,300 | $10,752 | $87,548 |
| 2018 | $2,645 | $95,335 | $10,752 | $84,583 |
| 2017 | $2,421 | $86,547 | $10,752 | $75,795 |
| 2016 | $2,064 | $73,792 | $10,752 | $63,040 |
| 2015 | $1,543 | $54,604 | $6,300 | $48,304 |
| 2014 | $1,621 | $57,369 | $6,300 | $51,069 |
Map
- 516 Forrest Ln
- 227 Sheryl Ln
- 2931 S Barrett Ave
- 905 Seymore Cir
- 601 Dubois St
- 711 Dubois St
- 938 Amsden St
- 618 Star St
- 819 Dubois St
- 3205 S College Blvd
- 3101 S College Blvd
- 909 Thatcher St
- 2721 Barret St
- 608 Baker St
- 603 W Star St
- 911 Thatcher St
- 87 Jade Ln
- 2531 S Mirick Ave
- 501 W Collins St
- 614 Rice St
Ask me questions while you tour the home.