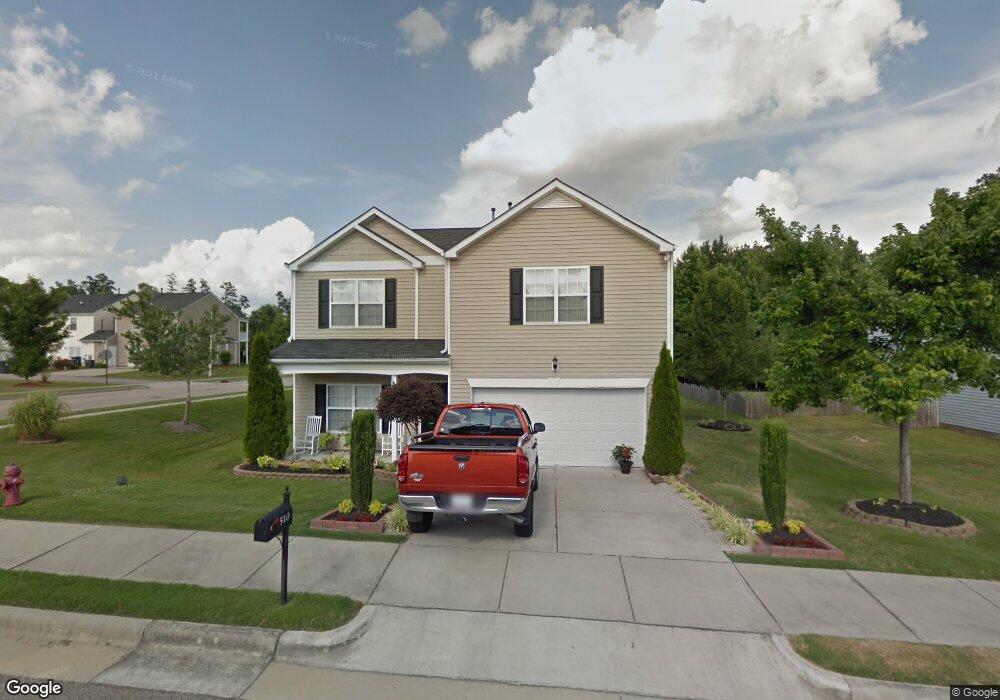
510 Jumping Frog Ln Knightdale, NC 27545
Estimated Value: $429,000 - $445,000
4
Beds
3
Baths
2,869
Sq Ft
$153/Sq Ft
Est. Value
About This Home
This home is located at 510 Jumping Frog Ln, Knightdale, NC 27545 and is currently estimated at $438,706, approximately $152 per square foot. 510 Jumping Frog Ln is a home located in Wake County with nearby schools including Knightdale Elementary School, Neuse River Middle School, and Knightdale High.
Ownership History
Date
Name
Owned For
Owner Type
Purchase Details
Closed on
Jul 23, 2020
Sold by
Montague Cedric and Montague Michelle
Bought by
Jaime Tarenz Martinez and Smith Katrina Evone
Current Estimated Value
Home Financials for this Owner
Home Financials are based on the most recent Mortgage that was taken out on this home.
Original Mortgage
$267,602
Outstanding Balance
$237,732
Interest Rate
3.2%
Mortgage Type
FHA
Estimated Equity
$200,974
Purchase Details
Closed on
Mar 31, 2006
Sold by
D R Horton Inc
Bought by
Montague Cedric and Montague Michelle
Home Financials for this Owner
Home Financials are based on the most recent Mortgage that was taken out on this home.
Original Mortgage
$165,307
Interest Rate
7.75%
Mortgage Type
Purchase Money Mortgage
Create a Home Valuation Report for This Property
The Home Valuation Report is an in-depth analysis detailing your home's value as well as a comparison with similar homes in the area
Home Values in the Area
Average Home Value in this Area
Purchase History
| Date | Buyer | Sale Price | Title Company |
|---|---|---|---|
| Jaime Tarenz Martinez | $293,000 | Omega Title Insurance Co | |
| Jamine Tarenz Martinez | $293,000 | None Listed On Document | |
| Montague Cedric | $207,000 | None Available |
Source: Public Records
Mortgage History
| Date | Status | Borrower | Loan Amount |
|---|---|---|---|
| Open | Jamine Tarenz Martinez | $267,602 | |
| Closed | Jamine Tarenz Martinez | $267,602 | |
| Previous Owner | Montague Cedric | $165,307 | |
| Previous Owner | Montague Cedric | $41,326 |
Source: Public Records
Tax History Compared to Growth
Tax History
| Year | Tax Paid | Tax Assessment Tax Assessment Total Assessment is a certain percentage of the fair market value that is determined by local assessors to be the total taxable value of land and additions on the property. | Land | Improvement |
|---|---|---|---|---|
| 2025 | $4,175 | $434,110 | $97,750 | $336,360 |
| 2024 | $4,159 | $434,110 | $97,750 | $336,360 |
| 2023 | $3,032 | $272,125 | $40,250 | $231,875 |
| 2022 | $2,930 | $272,125 | $40,250 | $231,875 |
| 2021 | $2,796 | $272,125 | $40,250 | $231,875 |
| 2020 | $2,796 | $272,125 | $40,250 | $231,875 |
| 2019 | $2,524 | $217,612 | $40,250 | $177,362 |
| 2018 | $2,380 | $217,612 | $40,250 | $177,362 |
| 2017 | $2,294 | $217,612 | $40,250 | $177,362 |
| 2016 | $2,262 | $217,612 | $40,250 | $177,362 |
| 2015 | $2,312 | $219,390 | $32,000 | $187,390 |
| 2014 | $2,231 | $219,390 | $32,000 | $187,390 |
Source: Public Records
Map
Nearby Homes
- 1456 Jay Rd
- 1466 Jay Rd
- 1463 Jay Rd
- 1452 Jay Rd
- 444 Haywood Glen Dr
- 1580 Goldfinch Perch Ln
- 1444 Jay Rd
- 1728 Goldfinch Perch Ln
- 1440 Jay Rd
- 1704 Goldfinch Perch Ln
- 1442 Jay Rd
- 1712 Goldfinch Perch Ln
- 1448 Jay Rd
- 1504 Wader Cir
- 1512 Wader Cir
- 1516 Wader Cir
- 1500 Wader Cir
- 1508 Wader Cir
- 702 Calavaras Ln
- 506 Sternwheel Way
- 508 Jumping Frog Ln
- 602 Jumping Frog Ln
- 501 Sternwheel Way
- 509 Jumping Frog Ln
- 506 Jumping Frog Ln
- 933 Cassa Clubhouse Way
- 620 Juniper Berry Rd
- 604 Juniper Berry Rd
- 552 Ginger Mint Cir
- 544 Ginger Mint Cir
- 624 Juniper Berry Rd
- 1200 Blue Tansy Dr
- 1208 Blue Tansy Dr
- 1204 Blue Tansy Dr
- 608 Juniper Berry Rd
- 508 Ginger Mint Cir
- 612 Ginger Mint Cir
- 633 Juniper Berry Rd
- 520 Ginger Mint Cir
- 1024 Clove Pine Dr