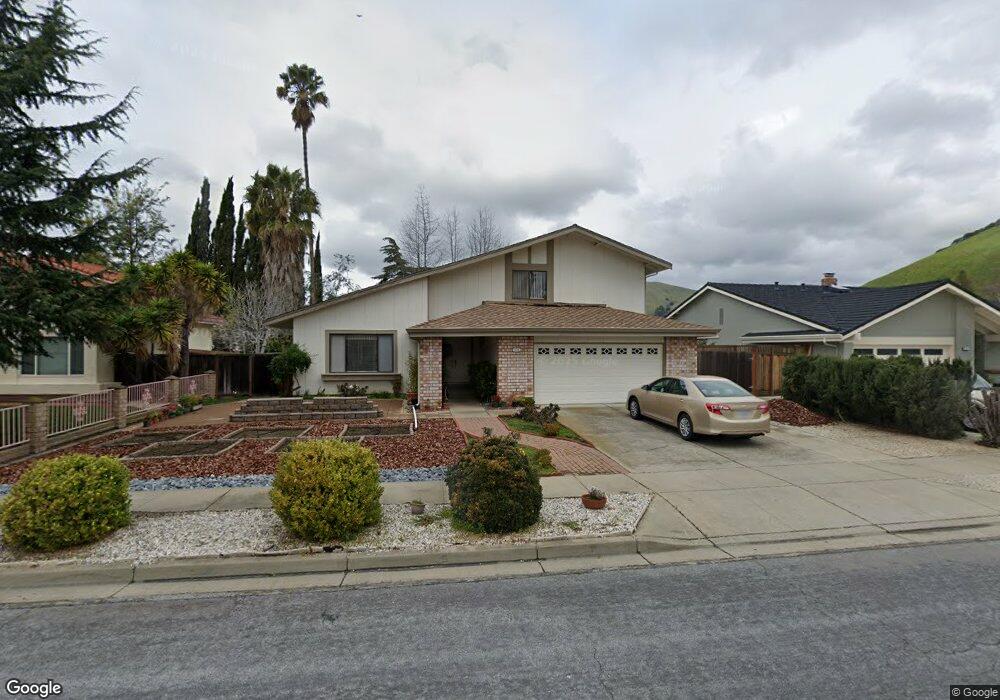
510 Lowell Place Fremont, CA 94536
Canyon Heights-Vallejo Mills NeighborhoodEstimated Value: $1,942,000 - $2,418,000
6
Beds
--
Bath
2,618
Sq Ft
$812/Sq Ft
Est. Value
About This Home
This home is located at 510 Lowell Place, Fremont, CA 94536 and is currently estimated at $2,126,023, approximately $812 per square foot. 510 Lowell Place is a home located in Alameda County with nearby schools including Vallejo Mill Elementary School, Centerville Junior High School, and Washington High School.
Ownership History
Date
Name
Owned For
Owner Type
Purchase Details
Closed on
Feb 22, 2018
Sold by
Cheng Po Shin and Chen Ling Chun
Bought by
Cheng Po Shin and Chen Ling Chun
Current Estimated Value
Create a Home Valuation Report for This Property
The Home Valuation Report is an in-depth analysis detailing your home's value as well as a comparison with similar homes in the area
Home Values in the Area
Average Home Value in this Area
Purchase History
| Date | Buyer | Sale Price | Title Company |
|---|---|---|---|
| Cheng Po Shin | -- | None Available | |
| Cheng Po Shin | -- | None Available |
Source: Public Records
Tax History Compared to Growth
Tax History
| Year | Tax Paid | Tax Assessment Tax Assessment Total Assessment is a certain percentage of the fair market value that is determined by local assessors to be the total taxable value of land and additions on the property. | Land | Improvement |
|---|---|---|---|---|
| 2025 | $5,617 | $438,548 | $89,207 | $356,341 |
| 2024 | $5,617 | $429,812 | $87,458 | $349,354 |
| 2023 | $5,453 | $428,248 | $85,743 | $342,505 |
| 2022 | $5,365 | $412,852 | $84,062 | $335,790 |
| 2021 | $5,235 | $404,621 | $82,414 | $329,207 |
| 2020 | $5,199 | $407,401 | $81,569 | $325,832 |
| 2019 | $5,214 | $399,414 | $79,970 | $319,444 |
| 2018 | $5,109 | $391,585 | $78,403 | $313,182 |
| 2017 | $4,981 | $383,906 | $76,865 | $307,041 |
| 2016 | $4,887 | $376,380 | $75,358 | $301,022 |
| 2015 | $4,814 | $370,729 | $74,227 | $296,502 |
| 2014 | $4,749 | $365,468 | $72,773 | $292,695 |
Source: Public Records
Map
Nearby Homes
- 599 Wasatch Dr
- 38367 Oliver Way
- 22 Sea Crest Terrace
- 38345 Timpanogas Cir
- 711 Old Canyon Rd Unit SPC 33
- 711 Old Canyon Rd Unit 6
- 711 Old Canyon Rd Unit 97
- 711 Old Canyon Rd Unit 77
- 711 Old Canyon Rd Unit 47
- 711 Old Canyon Rd Unit 176
- 711 Old Canyon Rd Unit 103
- 711 Old Canyon Rd Unit 56
- 38555 Overacker Ave
- 111 Overacker Terrace
- 4 Morrison Canyon Rd
- 2 Morrison Canyon Rd
- 3 Morrison Canyon Rd
- 865 Old Canyon Rd
- 118 Sycamore St
- 37915 Vallejo St
- 488 Lowell Place
- 524 Lowell Place
- 38695 Chrisholm Place
- 472 Lowell Place
- 38691 Chrisholm Place
- 511 Lowell Place
- 491 Lowell Place
- 458 Lowell Place
- 38720 Chrisholm Place
- 487 Lowell Place
- 525 Lowell Place
- 38698 Chrisholm Place
- 38686 Chrisholm Place
- 483 Lowell Place
- 38687 Chrisholm Place
- 454 Lowell Place
- 38742 Chrisholm Place
- 467 Lowell Place
- 38683 Chrisholm Place
- 479 Lowell Place