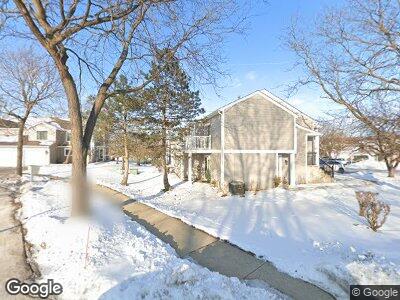
510 Mallard Ct Unit 491A Schaumburg, IL 60193
South Schaumburg NeighborhoodEstimated Value: $241,000 - $257,000
2
Beds
--
Bath
1,200
Sq Ft
$207/Sq Ft
Est. Value
About This Home
This home is located at 510 Mallard Ct Unit 491A, Schaumburg, IL 60193 and is currently estimated at $248,489, approximately $207 per square foot. 510 Mallard Ct Unit 491A is a home located in Cook County with nearby schools including Michael Collins Elementary School, Robert Frost Junior High School, and J B Conant High School.
Ownership History
Date
Name
Owned For
Owner Type
Purchase Details
Closed on
Mar 12, 2020
Sold by
Partners Fox Valley Llc
Bought by
Pomper Cheryl
Current Estimated Value
Home Financials for this Owner
Home Financials are based on the most recent Mortgage that was taken out on this home.
Original Mortgage
$70,000
Outstanding Balance
$63,176
Interest Rate
3.37%
Mortgage Type
New Conventional
Estimated Equity
$185,943
Purchase Details
Closed on
Jan 10, 2020
Sold by
Pitts Jill and Estate Of Richard L Amendola
Bought by
Fox Valley Llc
Home Financials for this Owner
Home Financials are based on the most recent Mortgage that was taken out on this home.
Original Mortgage
$137,600
Interest Rate
3.6%
Mortgage Type
Future Advance Clause Open End Mortgage
Purchase Details
Closed on
Oct 29, 1993
Sold by
Oppliger Diane S
Bought by
Amendola Richard L
Home Financials for this Owner
Home Financials are based on the most recent Mortgage that was taken out on this home.
Original Mortgage
$73,500
Interest Rate
7%
Create a Home Valuation Report for This Property
The Home Valuation Report is an in-depth analysis detailing your home's value as well as a comparison with similar homes in the area
Home Values in the Area
Average Home Value in this Area
Purchase History
| Date | Buyer | Sale Price | Title Company |
|---|---|---|---|
| Pomper Cheryl | $170,000 | Fidelity National Title | |
| Fox Valley Llc | $115,000 | Fidelity National Title | |
| Amendola Richard L | $62,333 | -- |
Source: Public Records
Mortgage History
| Date | Status | Borrower | Loan Amount |
|---|---|---|---|
| Open | Pomper Cheryl | $70,000 | |
| Previous Owner | Property Partners Of Fox Valley Llc | $137,600 | |
| Previous Owner | Amendola Richard L | $73,500 |
Source: Public Records
Tax History Compared to Growth
Tax History
| Year | Tax Paid | Tax Assessment Tax Assessment Total Assessment is a certain percentage of the fair market value that is determined by local assessors to be the total taxable value of land and additions on the property. | Land | Improvement |
|---|---|---|---|---|
| 2024 | $2,276 | $17,570 | $4,117 | $13,453 |
| 2023 | $2,276 | $17,570 | $4,117 | $13,453 |
| 2022 | $2,276 | $17,570 | $4,117 | $13,453 |
| 2021 | $4,289 | $14,152 | $2,245 | $11,907 |
| 2020 | $2,552 | $14,152 | $2,245 | $11,907 |
| 2019 | $3,296 | $15,725 | $2,245 | $13,480 |
| 2018 | $2,247 | $10,922 | $1,871 | $9,051 |
| 2017 | $2,229 | $10,922 | $1,871 | $9,051 |
| 2016 | $2,327 | $10,922 | $1,871 | $9,051 |
| 2015 | $2,120 | $9,711 | $1,684 | $8,027 |
| 2014 | $2,113 | $9,711 | $1,684 | $8,027 |
| 2013 | $2,042 | $9,711 | $1,684 | $8,027 |
Source: Public Records
Map
Nearby Homes
- 507 Mallard Ct Unit 507
- 402 Drake Cir Unit 332A
- 1030 Newport Harbor Unit 5701
- 625 Scholten Dr
- 704 Thames Dr
- 259 Nantucket Harbor Unit 402
- 643 Summit Dr
- 1223 Knottingham Ct Unit 2A
- 830 Knottingham Dr Unit 2B
- 617 Trent Ln
- 734 Bluejay Cir
- 920 Surrey Dr Unit 1A
- 114 Wiltshire Ct
- 711 Waterford Rd S Unit 2A
- 609 Berkshire Ct
- 437 Wingate Dr
- 1813 Longboat Dr
- 658 Cutter Ln
- 717 Killarney Ct Unit 2A
- 719 Killarney Ct Unit 2B
- 510 Mallard Ct Unit 491A
- 510 Mallard Ct Unit 1
- 512 Mallard Ct Unit 492A
- 514 Mallard Ct Unit 492B
- 516 Mallard Ct Unit 491B
- 506 Mallard Ct Unit 481B
- 502 Mallard Ct Unit 482A
- 502 Mallard Ct Unit 502
- 500 Mallard Ct Unit 481A
- 966 Mallard Cir Unit 511A
- 976 Mallard Cir Unit 501A
- 504 Mallard Ct Unit 482B
- 970 Mallard Cir Unit 501B
- 964 Mallard Cir Unit 512A
- 974 Mallard Cir Unit 502A
- 972 Mallard Cir Unit 2
- 972 Mallard Cir Unit 502B
- 962 Mallard Cir Unit 512B
- 960 Mallard Cir Unit 511B
- 916 Cartwright Ct