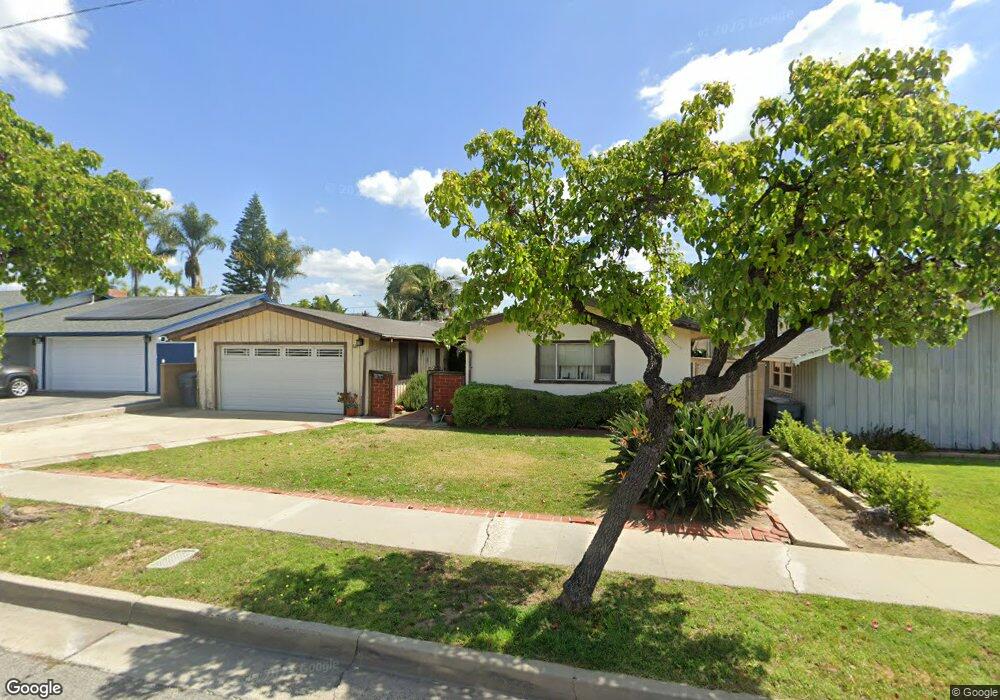
510 Maple St La Habra, CA 90631
Estimated Value: $869,000 - $994,000
4
Beds
2
Baths
1,771
Sq Ft
$530/Sq Ft
Est. Value
About This Home
This home is located at 510 Maple St, La Habra, CA 90631 and is currently estimated at $939,023, approximately $530 per square foot. 510 Maple St is a home located in Orange County with nearby schools including Arbolita Elementary School, El Cerrito Elementary School, and Washington Middle School.
Ownership History
Date
Name
Owned For
Owner Type
Purchase Details
Closed on
Dec 3, 2024
Sold by
Lujan Kathi L
Bought by
Kathi Lujan Trust and Lujan
Current Estimated Value
Purchase Details
Closed on
Oct 20, 1997
Sold by
Coles Darrick and Coles Peri Lynn
Bought by
Lujan Kathi L
Home Financials for this Owner
Home Financials are based on the most recent Mortgage that was taken out on this home.
Original Mortgage
$110,900
Interest Rate
7.31%
Purchase Details
Closed on
Aug 12, 1993
Sold by
Mattler James E
Bought by
Coles Darrick
Home Financials for this Owner
Home Financials are based on the most recent Mortgage that was taken out on this home.
Original Mortgage
$152,900
Interest Rate
3.25%
Create a Home Valuation Report for This Property
The Home Valuation Report is an in-depth analysis detailing your home's value as well as a comparison with similar homes in the area
Home Values in the Area
Average Home Value in this Area
Purchase History
| Date | Buyer | Sale Price | Title Company |
|---|---|---|---|
| Kathi Lujan Trust | -- | None Listed On Document | |
| Kathi Lujan Trust | -- | None Listed On Document | |
| Lujan Kathi L | $157,500 | Guardian Title Company | |
| Coles Darrick | $170,000 | Chicago Title Company |
Source: Public Records
Mortgage History
| Date | Status | Borrower | Loan Amount |
|---|---|---|---|
| Previous Owner | Lujan Kathi L | $110,900 | |
| Previous Owner | Coles Darrick | $152,900 | |
| Closed | Lujan Kathi L | $23,600 |
Source: Public Records
Tax History Compared to Growth
Tax History
| Year | Tax Paid | Tax Assessment Tax Assessment Total Assessment is a certain percentage of the fair market value that is determined by local assessors to be the total taxable value of land and additions on the property. | Land | Improvement |
|---|---|---|---|---|
| 2025 | $2,994 | $251,475 | $171,749 | $79,726 |
| 2024 | $2,994 | $246,545 | $168,382 | $78,163 |
| 2023 | $2,922 | $241,711 | $165,080 | $76,631 |
| 2022 | $2,887 | $236,972 | $161,843 | $75,129 |
| 2021 | $2,839 | $232,326 | $158,670 | $73,656 |
| 2020 | $2,812 | $229,944 | $157,043 | $72,901 |
| 2019 | $2,737 | $225,436 | $153,964 | $71,472 |
| 2018 | $2,691 | $221,016 | $150,945 | $70,071 |
| 2017 | $2,642 | $216,683 | $147,985 | $68,698 |
| 2016 | $2,580 | $212,435 | $145,084 | $67,351 |
| 2015 | $2,507 | $209,245 | $142,905 | $66,340 |
| 2014 | $2,433 | $205,147 | $140,106 | $65,041 |
Source: Public Records
Map
Nearby Homes
- Plan 4 - The Sage at The Birchwoods
- Plan 2 - The Poppy at The Birchwoods
- 994 E La Habra Blvd Unit 246
- 760 N Orange St
- 762 N Orange St
- 764 N Orange St
- 766 N Orange St
- 770 N Orange St
- 1018 E La Habra Blvd Unit 238
- 570 E 2nd Ave
- 308 S Valencia St
- 1400 Eastpark Dr
- 410 N Fonda St
- 303 S Cadiz Ct
- 1100 N Euclid St
- 313 W 1st Ave Unit M
- 224 S Fonda St
- 1241 Arbolita Dr
- 950 N Walnut St
- 621 S Olive Ave
- 520 Maple St
- 500 Maple St
- 511 N Mcpherson St
- 530 Maple St
- 521 N Mcpherson St
- 501 N Mcpherson St
- 511 Maple St
- 531 N Mcpherson St
- 521 Maple St
- 501 Maple St
- 421 N Mcpherson St
- 540 Maple St
- 531 Maple St
- 541 N Mcpherson St
- 610 E Francis Ave
- 550 Maple St
- 541 Maple St
- 417 N Mcpherson St
- 606 E Francis Ave
- 551 N Mcpherson St