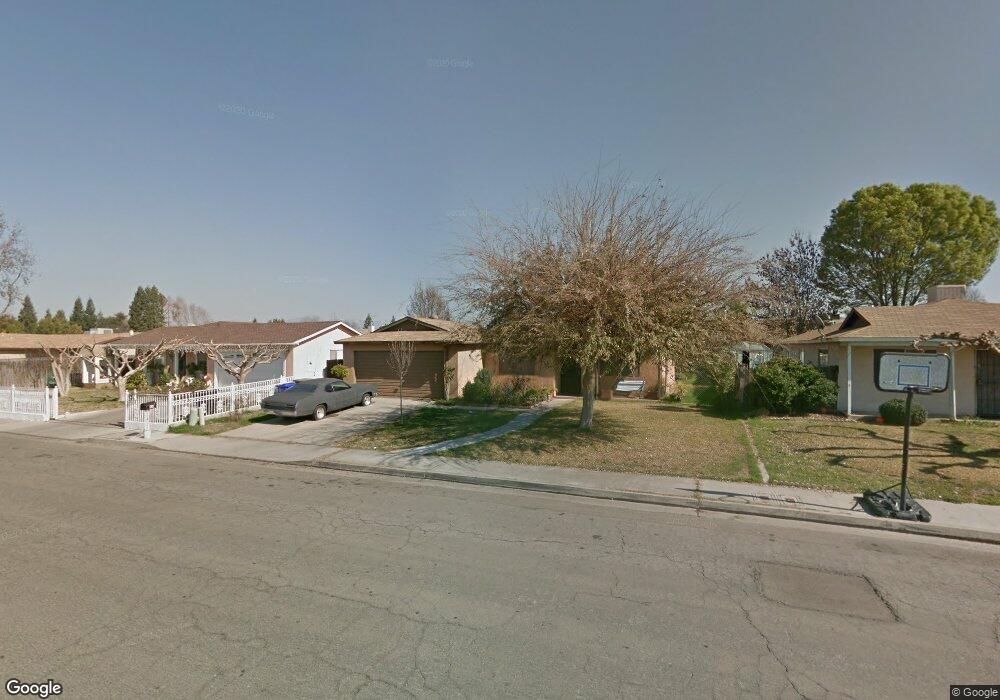
510 N Balmayne St Porterville, CA 93257
Porterville Northwest NeighborhoodEstimated Value: $234,000 - $280,000
2
Beds
1
Bath
950
Sq Ft
$279/Sq Ft
Est. Value
About This Home
This home is located at 510 N Balmayne St, Porterville, CA 93257 and is currently estimated at $265,264, approximately $279 per square foot. 510 N Balmayne St is a home located in Tulare County with nearby schools including Jim Maples Academy, Burton Middle School, and Monache High School.
Ownership History
Date
Name
Owned For
Owner Type
Purchase Details
Closed on
Dec 1, 2020
Sold by
Martinez Daniel
Bought by
Martinez Rogelio
Current Estimated Value
Purchase Details
Closed on
Aug 19, 2020
Sold by
Martinez Daniel
Bought by
Martinez Rogelio
Purchase Details
Closed on
Feb 13, 2001
Sold by
Mccarthy Edward C
Bought by
Martinez Daniel
Home Financials for this Owner
Home Financials are based on the most recent Mortgage that was taken out on this home.
Original Mortgage
$65,500
Outstanding Balance
$23,465
Interest Rate
6.97%
Estimated Equity
$241,799
Purchase Details
Closed on
Sep 13, 1993
Sold by
Mccarthywho Roxana E
Bought by
Mccarthy Edward C and Mccarthy Roxana E
Home Financials for this Owner
Home Financials are based on the most recent Mortgage that was taken out on this home.
Original Mortgage
$48,000
Interest Rate
7.13%
Create a Home Valuation Report for This Property
The Home Valuation Report is an in-depth analysis detailing your home's value as well as a comparison with similar homes in the area
Home Values in the Area
Average Home Value in this Area
Purchase History
| Date | Buyer | Sale Price | Title Company |
|---|---|---|---|
| Martinez Rogelio | -- | None Available | |
| Martinez Rogelio | -- | None Available | |
| Martinez Daniel | $69,000 | Fidelity National Title Co | |
| Mccarthy Edward C | -- | Old Republic Title Co |
Source: Public Records
Mortgage History
| Date | Status | Borrower | Loan Amount |
|---|---|---|---|
| Open | Martinez Daniel | $65,500 | |
| Previous Owner | Mccarthy Edward C | $48,000 |
Source: Public Records
Tax History Compared to Growth
Tax History
| Year | Tax Paid | Tax Assessment Tax Assessment Total Assessment is a certain percentage of the fair market value that is determined by local assessors to be the total taxable value of land and additions on the property. | Land | Improvement |
|---|---|---|---|---|
| 2025 | $1,876 | $178,599 | $48,709 | $129,890 |
| 2024 | $1,876 | $175,098 | $47,754 | $127,344 |
| 2023 | $1,881 | $171,666 | $46,818 | $124,848 |
| 2022 | $1,809 | $168,300 | $45,900 | $122,400 |
| 2021 | $1,036 | $95,986 | $34,803 | $61,183 |
| 2020 | $1,017 | $95,002 | $34,446 | $60,556 |
| 2019 | $1,017 | $93,140 | $33,771 | $59,369 |
| 2018 | $972 | $91,314 | $33,109 | $58,205 |
| 2017 | $956 | $89,524 | $32,460 | $57,064 |
| 2016 | $911 | $87,769 | $31,824 | $55,945 |
| 2015 | $879 | $86,451 | $31,346 | $55,105 |
| 2014 | $879 | $84,758 | $30,732 | $54,026 |
Source: Public Records
Map
Nearby Homes
- 2070 W Harrison Ave
- 313 Balmoral Dr
- 2300 W Morton Ave Unit 163
- 2300 W Morton Ave Unit 22
- 2300 W Morton Ave Unit 135
- 595 N Salisbury St
- 1771 W Aurora Ct
- 2434 W Kanai Ave
- 1730 W Grand Ave
- 2219 W Theta Ave
- 575 N Brandy Way
- 22346 W Thurman Ave
- 1690 Memory Ln
- 2179 W Della Ave
- 22250 Avenue 154
- 1750 W Terry Cir
- Sydney Plan at Laurelwood
- Carlton Plan at Laurelwood
- Carmel Plan at Laurelwood
- Aspen with Loft Plan at Laurelwood
- 520 N Balmayne St
- 500 N Balmayne St
- 515 N Fir Way
- 507 N Fir Way
- 525 N Fir Way
- 490 N Balmayne St
- 2141 W Belleview Ave
- 530 Balmayne Way
- 533 N Fir Way
- 2140 W Aurora Ave
- 491 N Fir Way
- 531 Balmayne Way
- 541 N Fir Way
- 2151 W Belleview Ave
- 540 Balmayne Way
- 480 N Balmayne St
- 2150 W Aurora Ave
- 481 N Fir Way
- 541 Balmayne St
- 518 N Fir Way