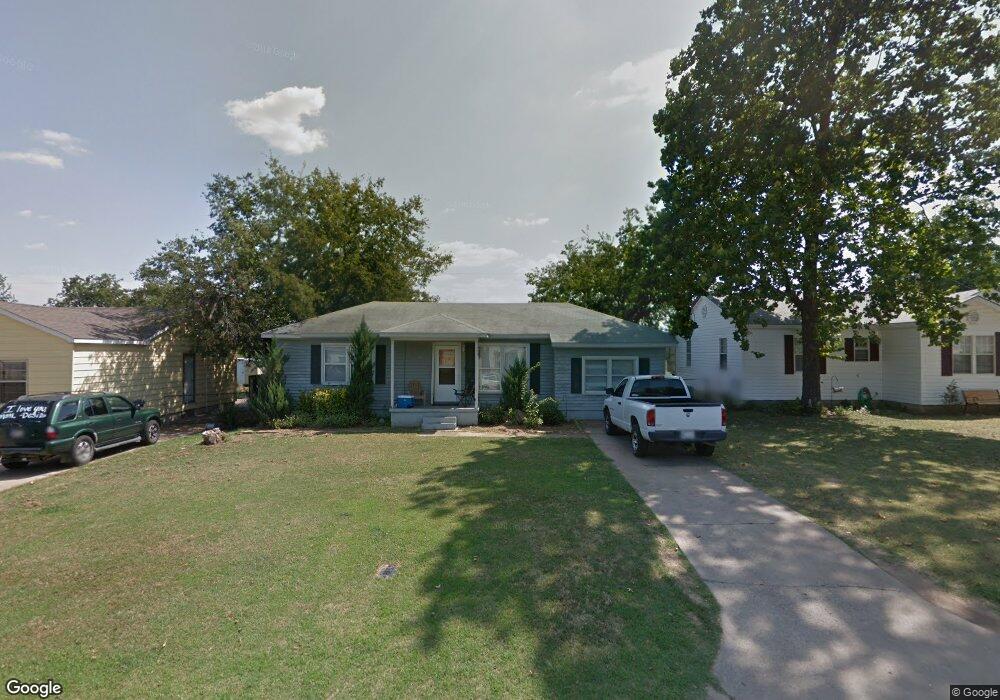
510 Oak St Ardmore, OK 73401
Estimated Value: $84,521 - $114,000
2
Beds
1
Bath
984
Sq Ft
$105/Sq Ft
Est. Value
About This Home
This home is located at 510 Oak St, Ardmore, OK 73401 and is currently estimated at $103,630, approximately $105 per square foot. 510 Oak St is a home located in Carter County with nearby schools including Charles Evans Elementary School, Ardmore Middle School, and Ardmore High School.
Ownership History
Date
Name
Owned For
Owner Type
Purchase Details
Closed on
Oct 7, 2005
Sold by
White Jonny M and White Diane M
Bought by
Mckinney Edward F
Current Estimated Value
Home Financials for this Owner
Home Financials are based on the most recent Mortgage that was taken out on this home.
Original Mortgage
$61,509
Outstanding Balance
$32,457
Interest Rate
5.73%
Mortgage Type
FHA
Estimated Equity
$71,173
Purchase Details
Closed on
Oct 10, 2003
Sold by
Blankenship Sam and Blankenship Ann
Bought by
White Jonny M White Joel
Create a Home Valuation Report for This Property
The Home Valuation Report is an in-depth analysis detailing your home's value as well as a comparison with similar homes in the area
Home Values in the Area
Average Home Value in this Area
Purchase History
| Date | Buyer | Sale Price | Title Company |
|---|---|---|---|
| Mckinney Edward F | $64,166 | -- | |
| White Jonny M White Joel | $20,000 | -- |
Source: Public Records
Mortgage History
| Date | Status | Borrower | Loan Amount |
|---|---|---|---|
| Open | Mckinney Edward F | $61,509 |
Source: Public Records
Tax History Compared to Growth
Tax History
| Year | Tax Paid | Tax Assessment Tax Assessment Total Assessment is a certain percentage of the fair market value that is determined by local assessors to be the total taxable value of land and additions on the property. | Land | Improvement |
|---|---|---|---|---|
| 2025 | $766 | $7,674 | $1,200 | $6,474 |
| 2024 | $766 | $7,309 | $1,200 | $6,109 |
| 2023 | $730 | $6,961 | $1,200 | $5,761 |
| 2022 | $634 | $6,629 | $1,200 | $5,429 |
| 2021 | $637 | $6,314 | $1,200 | $5,114 |
| 2020 | $657 | $6,608 | $720 | $5,888 |
| 2019 | $642 | $6,608 | $720 | $5,888 |
| 2018 | $666 | $6,747 | $720 | $6,027 |
| 2017 | $631 | $6,896 | $720 | $6,176 |
| 2016 | $612 | $6,568 | $720 | $5,848 |
| 2015 | $481 | $6,256 | $369 | $5,887 |
| 2014 | $533 | $5,958 | $369 | $5,589 |
Source: Public Records
Map
Nearby Homes
- 1817 Comanche St
- 434 Locust St NW
- 430 Locust St
- 703 Cottonwood St
- 1740 Tiverton St
- 505 Campbell St
- 715 Ash St
- 800 Cottonwood St
- 1714 Salisbury St
- 1750 Mount Washington Rd
- 723 Maxwell St NW
- 1907 Robison St
- 722 Maxwell St NW
- 132 Veterans Blvd
- 912 Elm St
- 912 Maxwell St NW
- 0 15th Unit 2546881
- 809 Campbell St
- 00 N Rockford Rd
- 923 Maxwell St NW