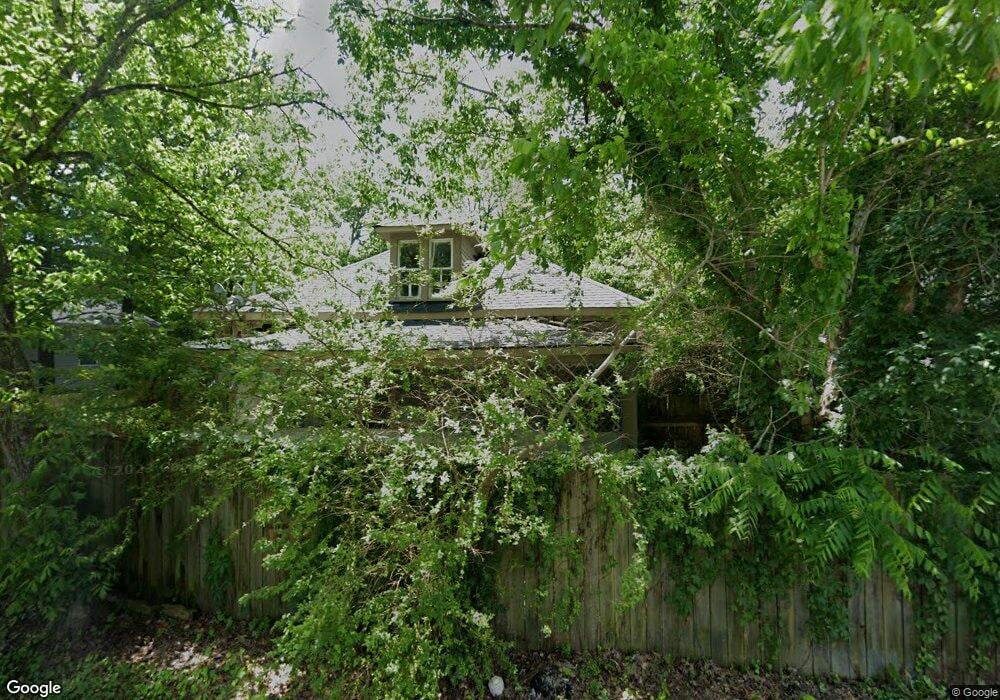
510 Oak St Shelbyville, TN 37160
Estimated Value: $119,000 - $180,000
--
Bed
1
Bath
1,368
Sq Ft
$104/Sq Ft
Est. Value
About This Home
This home is located at 510 Oak St, Shelbyville, TN 37160 and is currently estimated at $142,242, approximately $103 per square foot. 510 Oak St is a home located in Bedford County with nearby schools including East Side Elementary School, Harris Middle School, and Christian Chapel Academy.
Ownership History
Date
Name
Owned For
Owner Type
Purchase Details
Closed on
Mar 29, 2021
Sold by
Cervantes Ma Mira Leon
Bought by
Marquez Pablo Sergio Garcia
Current Estimated Value
Purchase Details
Closed on
Oct 14, 2019
Sold by
Beraza Melinda
Bought by
Marquez Pablo Sergio Garcia and Cervantes Ma Irma Leon
Purchase Details
Closed on
Dec 29, 2004
Sold by
Union Planters Bank
Bought by
Beraza Melinda
Purchase Details
Closed on
Dec 23, 2004
Bought by
Beraza Melinda
Purchase Details
Closed on
Feb 19, 1991
Bought by
Batten Larry C
Purchase Details
Closed on
Feb 18, 1991
Bought by
Sanders Thomas
Purchase Details
Closed on
Feb 10, 1989
Bought by
Overcast Ricky and Overcast Brenda
Purchase Details
Closed on
May 7, 1984
Bought by
Pack James E
Create a Home Valuation Report for This Property
The Home Valuation Report is an in-depth analysis detailing your home's value as well as a comparison with similar homes in the area
Home Values in the Area
Average Home Value in this Area
Purchase History
| Date | Buyer | Sale Price | Title Company |
|---|---|---|---|
| Marquez Pablo Sergio Garcia | -- | None Available | |
| Marquez Pablo Sergio Garcia | $50,000 | None Available | |
| Beraza Melinda | $16,500 | -- | |
| Beraza Melinda | $16,500 | -- | |
| Beraza Melinda | $16,500 | -- | |
| Batten Larry C | $15,000 | -- | |
| Sanders Thomas | $5,000 | -- | |
| Overcast Ricky | $13,000 | -- | |
| Pack James E | -- | -- |
Source: Public Records
Tax History Compared to Growth
Tax History
| Year | Tax Paid | Tax Assessment Tax Assessment Total Assessment is a certain percentage of the fair market value that is determined by local assessors to be the total taxable value of land and additions on the property. | Land | Improvement |
|---|---|---|---|---|
| 2025 | -- | $24,750 | $0 | $0 |
| 2024 | -- | $24,750 | $4,225 | $20,525 |
| 2023 | $366 | $24,750 | $4,225 | $20,525 |
| 2022 | $654 | $16,700 | $4,225 | $12,475 |
| 2021 | $594 | $16,700 | $4,225 | $12,475 |
| 2020 | $380 | $16,700 | $4,225 | $12,475 |
| 2019 | $380 | $8,575 | $2,250 | $6,325 |
| 2018 | $372 | $8,575 | $2,250 | $6,325 |
| 2017 | $372 | $8,575 | $2,250 | $6,325 |
| 2016 | $368 | $8,575 | $2,250 | $6,325 |
| 2015 | $368 | $8,575 | $2,250 | $6,325 |
| 2014 | $322 | $8,213 | $0 | $0 |
Source: Public Records
Map
Nearby Homes
- 120 Dogwood Ct
- 220 Walnut St
- 709 Belmont Ave
- 222 Carter St
- 0 E Depot St
- 102 Germantown Rd
- 112 Elizabeth St
- 211 S Fairoak St
- 215 Coney Island Rd
- 207 Martha St
- 464 Whitthorne St
- 418 Riverview Dr
- 314 Maplewood Dr
- 627 E Lane St
- 631 E Lane St
- 527 Deery St
- 611 Coble Cir
- 508 Lewis Ave
- 702 Adams Dr
- 600 Lewis Ave