S
Seller's Agent in 2022
Sylvia Phillips
Era All In One Realty
(229) 888-6653
1 in this area
34 Total Sales


Estimated Value: $339,607
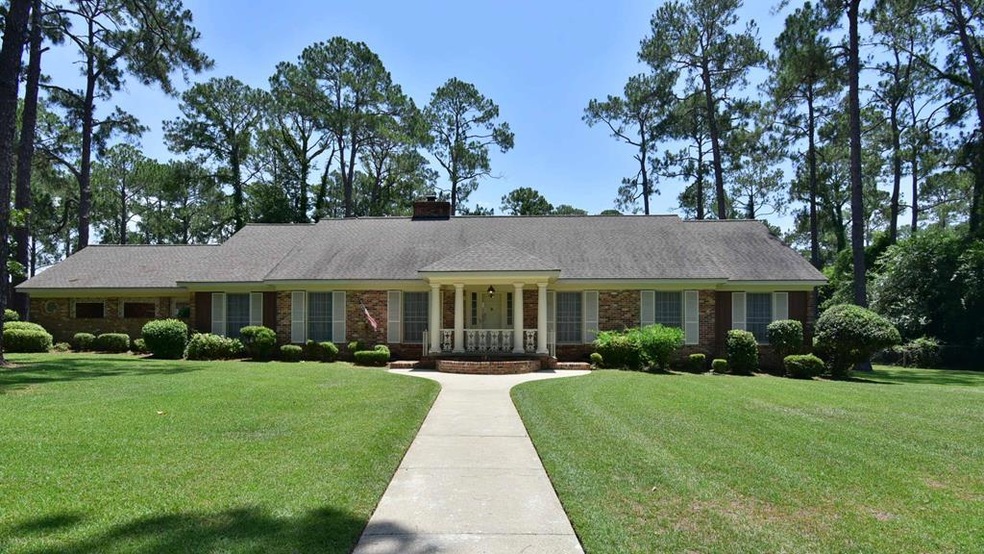
The Best Buy in NW Albany for a 5 bedroom completely updated with all new throughout. So Much to offer...This Home fits the needs for Family Privacy along with Mother-in-law suite. Fall is approaching and this is a Great Home for celebrating the seasons. Two fireplaces to decorate at Halloween, Thanksgiving and Christmas. There will be much Joy and Pleasure in the Move to this Home offering a Comfortable Lifestyle. . This Classic -Well Built 5 bedroom Home has been enhanced and upgraded from top to bottom. Enter a Welcoming Foyer that leads into the Formal Living Room with fireplace and the Formal Dining Room. New top of the line flooring throughout. The upgraded kitchen is remarkable. New granite counter tops, tile back splash, cabinet hardware, new stainless steel appliances to include double oven, stove top and vent hood, dishwasher and a Top of the Line Refrigerator. The Light, Airy and Large Open Den/Family room has a half bath, fireplace and built ins. The French Doors leads to an open brick patio overlooking the large fenced in back yard for family gatherings and children play. As a Bonus there is a Green House to grow your vegetables and flowers Spacious Master Bedroom downstairs with Master Bath. Two additional bedrooms downstairs and a full bath. The upstairs offers 2 very large bedrooms with full bath, half bath and a bonus room with much potential.. The bathrooms have been upgraded with new fixtures. New lighting throughout to include ceiling fans, chandeliers and inset lighting that enhances the Beauty. Roof 2017. Termite Bond. This Home Has Much to Offer. Lots of space for Family Gatherings, Children Activities and more. Easy Access to Schools, Church, Medical Facility, Shopping, Restaurants and more. Owners have priced to sell. Call today for your private viewing.
Last Agent to Sell the Property
Era All In One Realty Brokerage Phone: 2298886670 License #40521 Listed on: 11/29/2022

| Date | Buyer | Sale Price | Title Company |
|---|---|---|---|
| Frost Stephen | $305,000 | -- | |
| Roberts Owen Ray | $145,000 | -- | |
| Meier Mary J Condon | -- | -- |
| Date | Status | Borrower | Loan Amount |
|---|---|---|---|
| Open | Frost Stephen | $294,820 | |
| Previous Owner | Roberts Owen Ray | $144,848 |
| Date | Event | Price | List to Sale | Price per Sq Ft | Prior Sale |
|---|---|---|---|---|---|
| 12/16/2022 12/16/22 | Sold | $305,000 | +110.3% | $78 / Sq Ft | |
| 11/29/2022 11/29/22 | Pending | -- | -- | -- | |
| 10/08/2019 10/08/19 | Sold | $145,000 | -- | $37 / Sq Ft | View Prior Sale |
| 08/09/2019 08/09/19 | Pending | -- | -- | -- |
| Year | Tax Paid | Tax Assessment Tax Assessment Total Assessment is a certain percentage of the fair market value that is determined by local assessors to be the total taxable value of land and additions on the property. | Land | Improvement |
|---|---|---|---|---|
| 2024 | $3,259 | $68,320 | $17,840 | $50,480 |
| 2023 | $3,183 | $68,320 | $17,840 | $50,480 |
| 2022 | $3,195 | $68,320 | $17,840 | $50,480 |
| 2021 | $2,962 | $68,320 | $17,840 | $50,480 |
| 2020 | $2,520 | $68,320 | $17,840 | $50,480 |
| 2019 | $2,980 | $68,320 | $17,840 | $50,480 |
| 2018 | $3,224 | $73,600 | $17,840 | $55,760 |
| 2017 | $2,922 | $73,600 | $17,840 | $55,760 |
| 2016 | $2,923 | $73,600 | $17,840 | $55,760 |
| 2015 | $2,931 | $73,600 | $17,840 | $55,760 |
| 2014 | $2,693 | $68,600 | $12,840 | $55,760 |
S
Seller's Agent in 2022
Sylvia Phillips
Era All In One Realty
(229) 888-6653
1 in this area
34 Total Sales
A
Buyer's Agent in 2022
Amanda Wiley & K Team
Era All In One Realty
(229) 888-6670
36 in this area
2,614 Total Sales
B
Seller's Agent in 2019
BONNY H DOROUGH
Albany Realty Company
5 in this area
32 Total Sales
D
Seller Co-Listing Agent in 2019
Danny Blackshear
Albany Realty Company
(229) 883-6100
19 Total Sales
Source: Albany Board of REALTORS®
MLS Number: 150530
APN: 000GG-00021-001