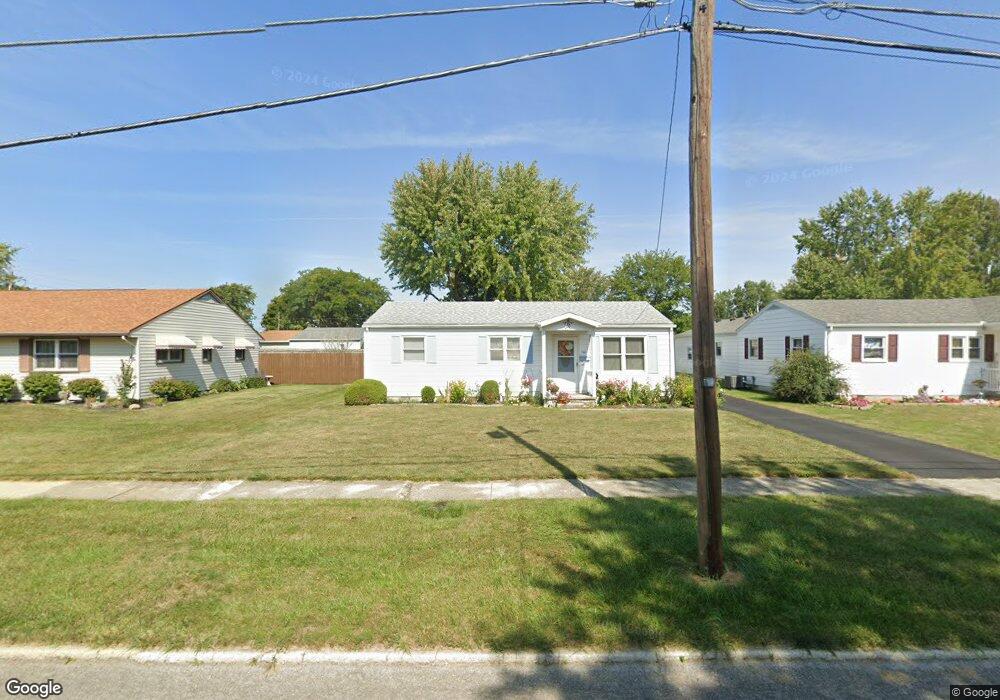
510 Prentiss Ave Findlay, OH 45840
Estimated Value: $181,974 - $206,000
3
Beds
2
Baths
1,416
Sq Ft
$137/Sq Ft
Est. Value
About This Home
This home is located at 510 Prentiss Ave, Findlay, OH 45840 and is currently estimated at $193,494, approximately $136 per square foot. 510 Prentiss Ave is a home located in Hancock County with nearby schools including Northview Elementary School, Bigelow Hill Elementary School, and Glenwood Middle School.
Create a Home Valuation Report for This Property
The Home Valuation Report is an in-depth analysis detailing your home's value as well as a comparison with similar homes in the area
Home Values in the Area
Average Home Value in this Area
Tax History Compared to Growth
Tax History
| Year | Tax Paid | Tax Assessment Tax Assessment Total Assessment is a certain percentage of the fair market value that is determined by local assessors to be the total taxable value of land and additions on the property. | Land | Improvement |
|---|---|---|---|---|
| 2024 | $1,239 | $44,670 | $5,990 | $38,680 |
| 2023 | $1,263 | $44,670 | $5,990 | $38,680 |
| 2022 | $1,281 | $44,670 | $5,990 | $38,680 |
| 2021 | $1,155 | $37,120 | $5,990 | $31,130 |
| 2020 | $1,155 | $37,120 | $5,990 | $31,130 |
| 2019 | $1,165 | $37,120 | $5,990 | $31,130 |
| 2018 | $965 | $30,950 | $4,790 | $26,160 |
| 2017 | $965 | $30,950 | $4,790 | $26,160 |
| 2016 | $949 | $30,640 | $4,790 | $25,850 |
| 2015 | $826 | $27,630 | $4,790 | $22,840 |
| 2014 | $826 | $27,630 | $4,790 | $22,840 |
| 2012 | $920 | $29,610 | $4,790 | $24,820 |
Source: Public Records
Map
Nearby Homes
- 643 Edith Ave
- 405 Clifton Ave
- 304 Rector Ave
- 304 Prentiss Ave
- 410 Monroe Ave
- 1934 Geffs Ave
- 905 W Melrose Ave
- 1820 N Main St
- 925 W Melrose Ave
- 604 Davis St
- 1825 Pershing St
- 533 Davis St
- 2100 Candlewick Dr
- 933 Laurel Ln
- 231 Tioga Ave
- 128 Harrington Ave
- 1005 Broad Ave
- 206 Midland Ave
- 115 George St
- 230 Midland Ave
- 504 Prentiss Ave
- 518 Prentiss Ave
- 500 Prentiss Ave
- 511 Lester Ave
- 517 Lester Ave
- 505 Lester Ave
- 521 Lester Ave
- 530 Prentiss Ave
- 501 Lester Ave
- 434 Prentiss Ave
- 509 Prentiss Ave
- 513 Prentiss Ave
- 505 Prentiss Ave
- 517 Prentiss Ave
- 501 Prentiss Ave
- 521 Prentiss Ave
- 435 Lester Ave
- 430 Prentiss Ave
- 527 Prentiss Ave
- 433 Lester Ave