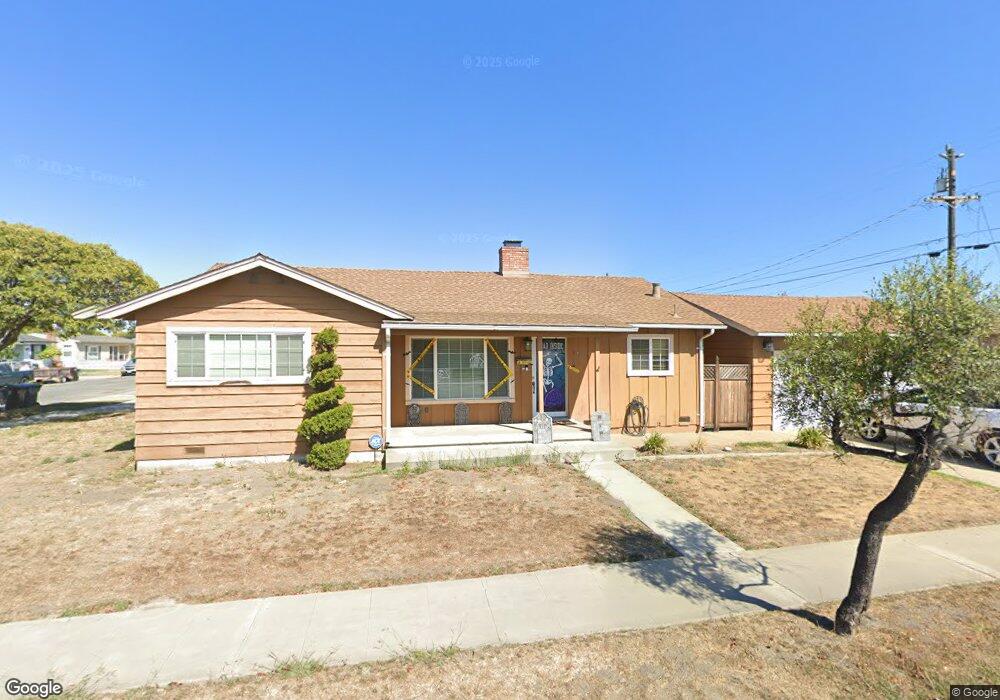
510 W Laurel Dr Salinas, CA 93906
Northridge NeighborhoodEstimated Value: $666,349 - $751,000
3
Beds
2
Baths
1,342
Sq Ft
$521/Sq Ft
Est. Value
About This Home
This home is located at 510 W Laurel Dr, Salinas, CA 93906 and is currently estimated at $698,837, approximately $520 per square foot. 510 W Laurel Dr is a home located in Monterey County with nearby schools including Henry F. Kammann Elementary School, Boronda Meadows Elementary School, and Harden Middle School.
Ownership History
Date
Name
Owned For
Owner Type
Purchase Details
Closed on
Aug 12, 2021
Sold by
Ramirez David P
Bought by
Ramirez Leticia
Current Estimated Value
Purchase Details
Closed on
Oct 17, 2007
Sold by
Ramirez Leticia and Ramirez David P
Bought by
Ramirez David P and Ramirez Leticia
Home Financials for this Owner
Home Financials are based on the most recent Mortgage that was taken out on this home.
Original Mortgage
$350,000
Outstanding Balance
$219,179
Interest Rate
6.27%
Mortgage Type
New Conventional
Estimated Equity
$479,658
Purchase Details
Closed on
Jan 18, 2002
Sold by
Ramirez Leticia
Bought by
Ramirez David P and Ramirez Leticia
Purchase Details
Closed on
Nov 30, 2001
Sold by
Gallegos Dolores P
Bought by
Ramirez Leticia
Purchase Details
Closed on
Jan 7, 1997
Sold by
Gallegos John S
Bought by
Gallegos Dolores
Home Financials for this Owner
Home Financials are based on the most recent Mortgage that was taken out on this home.
Original Mortgage
$95,000
Interest Rate
8.5%
Create a Home Valuation Report for This Property
The Home Valuation Report is an in-depth analysis detailing your home's value as well as a comparison with similar homes in the area
Home Values in the Area
Average Home Value in this Area
Purchase History
| Date | Buyer | Sale Price | Title Company |
|---|---|---|---|
| Ramirez Leticia | -- | None Available | |
| Ramirez David P | -- | Stewart Title Monterey | |
| Ramirez David P | -- | -- | |
| Ramirez Leticia | -- | -- | |
| Gallegos Dolores | $50,500 | Chicago Title Co |
Source: Public Records
Mortgage History
| Date | Status | Borrower | Loan Amount |
|---|---|---|---|
| Open | Ramirez David P | $350,000 | |
| Previous Owner | Gallegos Dolores | $95,000 |
Source: Public Records
Tax History Compared to Growth
Tax History
| Year | Tax Paid | Tax Assessment Tax Assessment Total Assessment is a certain percentage of the fair market value that is determined by local assessors to be the total taxable value of land and additions on the property. | Land | Improvement |
|---|---|---|---|---|
| 2025 | $1,045 | $93,919 | $23,530 | $70,389 |
| 2024 | $1,045 | $92,078 | $23,069 | $69,009 |
| 2023 | $1,009 | $90,273 | $22,617 | $67,656 |
| 2022 | $984 | $88,504 | $22,174 | $66,330 |
| 2021 | $1,006 | $86,770 | $21,740 | $65,030 |
| 2020 | $978 | $85,882 | $21,518 | $64,364 |
| 2019 | $969 | $84,199 | $21,097 | $63,102 |
| 2018 | $954 | $82,549 | $20,684 | $61,865 |
| 2017 | $955 | $80,931 | $20,279 | $60,652 |
| 2016 | $955 | $79,345 | $19,882 | $59,463 |
| 2015 | $963 | $78,154 | $19,584 | $58,570 |
| 2014 | $901 | $76,624 | $19,201 | $57,423 |
Source: Public Records
Map
Nearby Homes
- 1226 Monroe St
- 417 Tyler Place Unit I
- 1117 Baldwin St Unit 5
- 129 Rodeo Ave
- 114 Iris Dr
- 216 Crescent Way
- 983 Flint Way
- 225 Loma Dr
- 730 N Main St
- 1518 Duran Cir
- 1521 Ebro Cir
- 1588 Cherokee Dr
- 549 Powell St
- 1840 Cherokee Dr Unit 2
- 1575 Sepulveda Dr
- 44 Oconnor Cir
- 515 Stockton St
- 1690 Cherokee Dr
- 1861 Cherokee Dr Unit 1
- 424 Brighton St