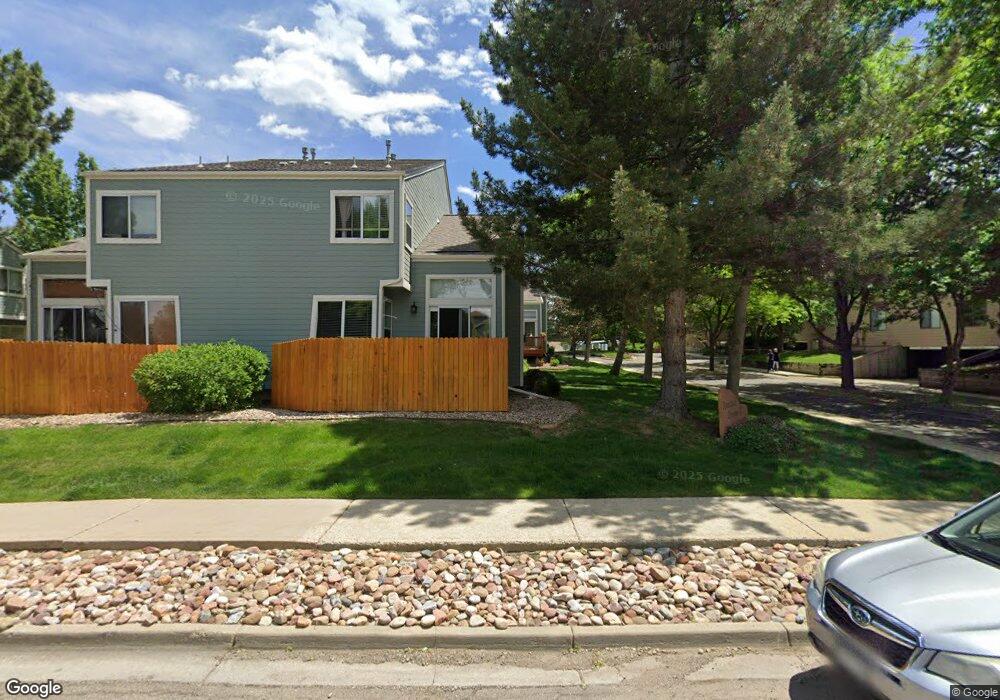
5100 Buckingham Rd Unit 2 Boulder, CO 80301
Gunbarrel NeighborhoodEstimated Value: $423,000 - $457,000
2
Beds
2
Baths
1,080
Sq Ft
$404/Sq Ft
Est. Value
About This Home
This home is located at 5100 Buckingham Rd Unit 2, Boulder, CO 80301 and is currently estimated at $435,847, approximately $403 per square foot. 5100 Buckingham Rd Unit 2 is a home located in Boulder County with nearby schools including Heatherwood Elementary School, Nevin Platt Middle School, and Boulder High School.
Ownership History
Date
Name
Owned For
Owner Type
Purchase Details
Closed on
Jul 14, 2011
Sold by
Gibson Sarah M
Bought by
Browne Kimberly
Current Estimated Value
Purchase Details
Closed on
Mar 30, 2000
Sold by
Renee Depew
Bought by
Gibson Sarah M
Home Financials for this Owner
Home Financials are based on the most recent Mortgage that was taken out on this home.
Original Mortgage
$123,750
Interest Rate
8.37%
Mortgage Type
Stand Alone First
Purchase Details
Closed on
Oct 28, 1993
Sold by
Felton Timothy M
Bought by
Depew Renee
Home Financials for this Owner
Home Financials are based on the most recent Mortgage that was taken out on this home.
Original Mortgage
$106,200
Interest Rate
4.25%
Purchase Details
Closed on
Dec 24, 1992
Bought by
Browne Kimberley
Purchase Details
Closed on
Dec 11, 1992
Bought by
Browne Kimberley
Create a Home Valuation Report for This Property
The Home Valuation Report is an in-depth analysis detailing your home's value as well as a comparison with similar homes in the area
Home Values in the Area
Average Home Value in this Area
Purchase History
| Date | Buyer | Sale Price | Title Company |
|---|---|---|---|
| Browne Kimberly | $185,000 | Fidelity National Title Insu | |
| Gibson Sarah M | $165,000 | Stewart Title | |
| Depew Renee | $118,500 | -- | |
| Browne Kimberley | $89,900 | -- | |
| Browne Kimberley | -- | -- |
Source: Public Records
Mortgage History
| Date | Status | Borrower | Loan Amount |
|---|---|---|---|
| Previous Owner | Gibson Sarah M | $123,750 | |
| Previous Owner | Depew Renee | $106,200 |
Source: Public Records
Tax History Compared to Growth
Tax History
| Year | Tax Paid | Tax Assessment Tax Assessment Total Assessment is a certain percentage of the fair market value that is determined by local assessors to be the total taxable value of land and additions on the property. | Land | Improvement |
|---|---|---|---|---|
| 2025 | $2,142 | $32,219 | -- | $32,219 |
| 2024 | $2,142 | $32,219 | -- | $32,219 |
| 2023 | $2,713 | $29,631 | -- | $33,316 |
| 2022 | $2,764 | $28,168 | $0 | $28,168 |
| 2021 | $2,637 | $28,979 | $0 | $28,979 |
| 2020 | $2,674 | $29,079 | $0 | $29,079 |
| 2019 | $2,632 | $29,079 | $0 | $29,079 |
| 2018 | $2,254 | $24,581 | $0 | $24,581 |
| 2017 | $2,187 | $27,175 | $0 | $27,175 |
| 2016 | $1,675 | $18,205 | $0 | $18,205 |
| 2015 | $1,592 | $15,124 | $0 | $15,124 |
| 2014 | $1,390 | $15,124 | $0 | $15,124 |
Source: Public Records
Map
Nearby Homes
- 5128 Buckingham Rd
- 5174 Buckingham Rd Unit L1
- 7481 Singing Hills Dr
- 7434 Singing Hills Ct Unit J7434
- 7443 Singing Hills Ct
- 7430 Clubhouse Rd
- 7400 Singing Hills Dr Unit K7400
- 4936 Clubhouse Cir
- 7329 Windsor Dr
- 5220 Desert Pine Ct
- 4993 Clubhouse Ct
- 7264 Siena Way Unit C
- 4953 Clubhouse Ct
- 4803 Briar Ridge Ct
- 7126 Cedarwood Cir
- 7134 Cedarwood Cir
- 7302 Island Cir
- 4697 Tanglewood Trail
- 5302 Pinehurst Dr
- 7238 Mount Sherman Rd
- 5102 Buckingham Rd
- 5110 Buckingham Rd Unit H3
- 5114 Buckingham Rd Unit H1
- 5104 Buckingham Rd Unit G4
- 5112 Buckingham Rd Unit H4
- 5112 Buckingham Rd Unit 4
- 5142 Buckingham Rd Unit 6
- 5108 Buckingham Rd Unit H2
- 5108 Buckingham Rd Unit 2
- 5144 Buckingham Rd
- 5132 Buckingham Rd
- 5106 Buckingham Rd Unit G1
- 5106 Buckingham Rd Unit 1
- 5138 Buckingham Rd
- 5136 Buckingham Rd
- 5140 Buckingham Rd Unit I5
- 5140 Buckingham Rd Unit 15
- 5140 Buckingham Rd Unit 5
- 5130 Buckingham Rd
- 5126 Buckingham Rd