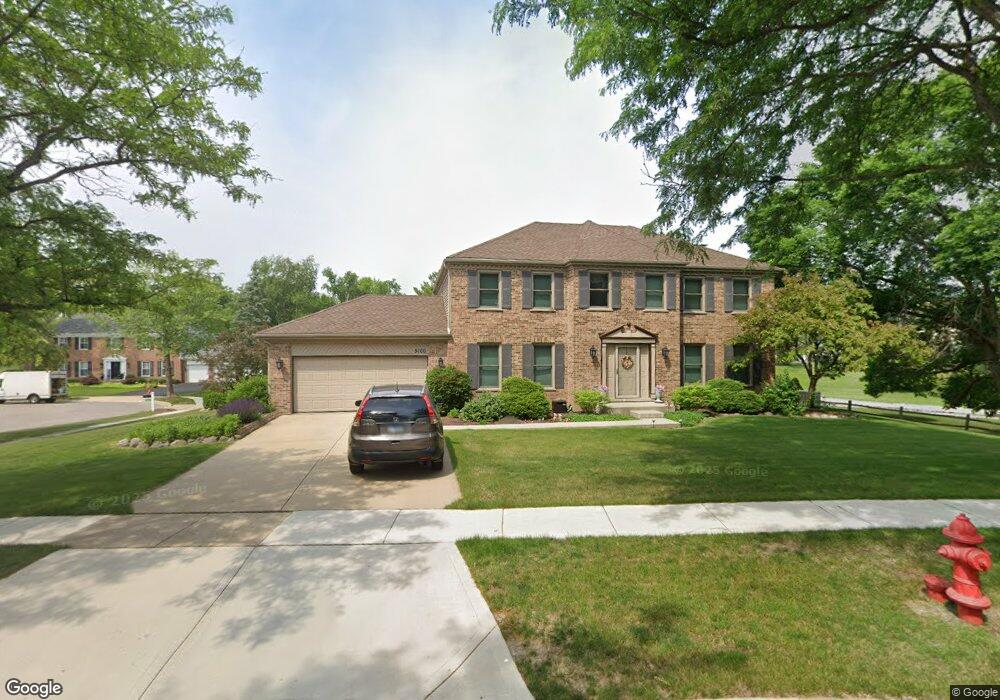
5100 Thornbark Dr Hoffman Estates, IL 60010
South Ridge NeighborhoodEstimated Value: $639,924 - $791,000
4
Beds
3
Baths
2,786
Sq Ft
$251/Sq Ft
Est. Value
About This Home
This home is located at 5100 Thornbark Dr, Hoffman Estates, IL 60010 and is currently estimated at $698,981, approximately $250 per square foot. 5100 Thornbark Dr is a home located in Cook County with nearby schools including Thomas Jefferson Elementary School, Marion Jordan Elementary School, and William Fremd High School.
Ownership History
Date
Name
Owned For
Owner Type
Purchase Details
Closed on
Jul 30, 2014
Sold by
Bordis Kevin P and Ljubenko Lauren N
Bought by
Mcnamara Ashley
Current Estimated Value
Purchase Details
Closed on
Jul 29, 2014
Sold by
Kowalksi Joseph M and Kowalski Quin F
Bought by
Kowalski Family Trust #14E036
Purchase Details
Closed on
Jul 25, 2013
Sold by
Chicago Title Land Trust Co
Bought by
Bordis Kevin P and Ljubenko Lauren N
Home Financials for this Owner
Home Financials are based on the most recent Mortgage that was taken out on this home.
Original Mortgage
$125,130
Interest Rate
5.25%
Mortgage Type
New Conventional
Purchase Details
Closed on
Jun 3, 2003
Sold by
Hanson H Donald and Hanson Marilee
Bought by
Kowalski Joseph M and Kowalski Quin E
Home Financials for this Owner
Home Financials are based on the most recent Mortgage that was taken out on this home.
Original Mortgage
$300,000
Interest Rate
3.5%
Mortgage Type
Purchase Money Mortgage
Create a Home Valuation Report for This Property
The Home Valuation Report is an in-depth analysis detailing your home's value as well as a comparison with similar homes in the area
Home Values in the Area
Average Home Value in this Area
Purchase History
| Date | Buyer | Sale Price | Title Company |
|---|---|---|---|
| Mcnamara Ashley | $168,000 | Greater Metropolitan Title L | |
| Kowalski Family Trust #14E036 | -- | None Available | |
| Bordis Kevin P | $129,000 | Chicago Title Land Trust Com | |
| Kowalski Joseph M | $450,000 | 1St American Title |
Source: Public Records
Mortgage History
| Date | Status | Borrower | Loan Amount |
|---|---|---|---|
| Previous Owner | Bordis Kevin P | $125,130 | |
| Previous Owner | Kowalski Joseph M | $300,000 |
Source: Public Records
Tax History
| Year | Tax Paid | Tax Assessment Tax Assessment Total Assessment is a certain percentage of the fair market value that is determined by local assessors to be the total taxable value of land and additions on the property. | Land | Improvement |
|---|---|---|---|---|
| 2025 | $10,133 | $55,759 | $15,083 | $40,676 |
| 2024 | $10,133 | $36,183 | $12,669 | $23,514 |
| 2023 | $9,759 | $36,183 | $12,669 | $23,514 |
| 2022 | $9,759 | $36,183 | $12,669 | $23,514 |
| 2021 | $10,876 | $35,624 | $7,541 | $28,083 |
| 2020 | $11,559 | $38,215 | $7,541 | $30,674 |
| 2019 | $11,390 | $42,227 | $7,541 | $34,686 |
| 2018 | $11,233 | $38,812 | $6,937 | $31,875 |
| 2017 | $11,036 | $38,812 | $6,937 | $31,875 |
| 2016 | $11,818 | $43,350 | $6,937 | $36,413 |
| 2015 | $11,282 | $38,847 | $6,334 | $32,513 |
| 2014 | $11,085 | $38,847 | $6,334 | $32,513 |
| 2013 | $12,499 | $44,640 | $6,334 | $38,306 |
Source: Public Records
Map
Nearby Homes
- 5190 Chambers Dr
- 4990 Rochester Dr
- 1280 Clover Ln
- 217 Haman Rd
- 4480 Thornbark Dr
- 4475 Olmstead Dr
- 1520 Macalpin Cir Unit 2
- 4485 Bayside Cir
- 10 Carnoustie Ln
- 1690 Cape Breton Ct
- 1842 Thomas Atkinson Rd
- 2204 Shetland Rd
- 1350 Macalpin Dr
- 4175 Victoria Dr
- 926 Braeburn Rd
- 4490 Capstan Dr
- 1340 Macalpin Dr
- 61 E Palatine Rd
- 4100 N Victoria Dr
- 61 E Rd
- 5090 Thornbark Dr
- 5080 Thornbark Dr
- 5060 Thornbark Dr
- 5151 N Tamarack Dr
- 5141 N Tamarack Dr
- 5161 N Tamarack Dr
- 5131 N Tamarack Dr
- 5061 Thornbark Dr
- 5181 N Tamarack Dr
- 5191 N Tamarack Dr
- 5050 Thornbark Dr
- 5121 N Tamarack Dr
- 5145 Thornbark Dr
- 5051 Thornbark Dr
- 5040 Thornbark Dr
- 5111 N Tamarack Dr
- 5140 N Tamarack Dr
- 5155 Thornbark Dr
- 5160 N Tamarack Dr
- 5071 N Tamarack Dr
Your Personal Tour Guide
Ask me questions while you tour the home.