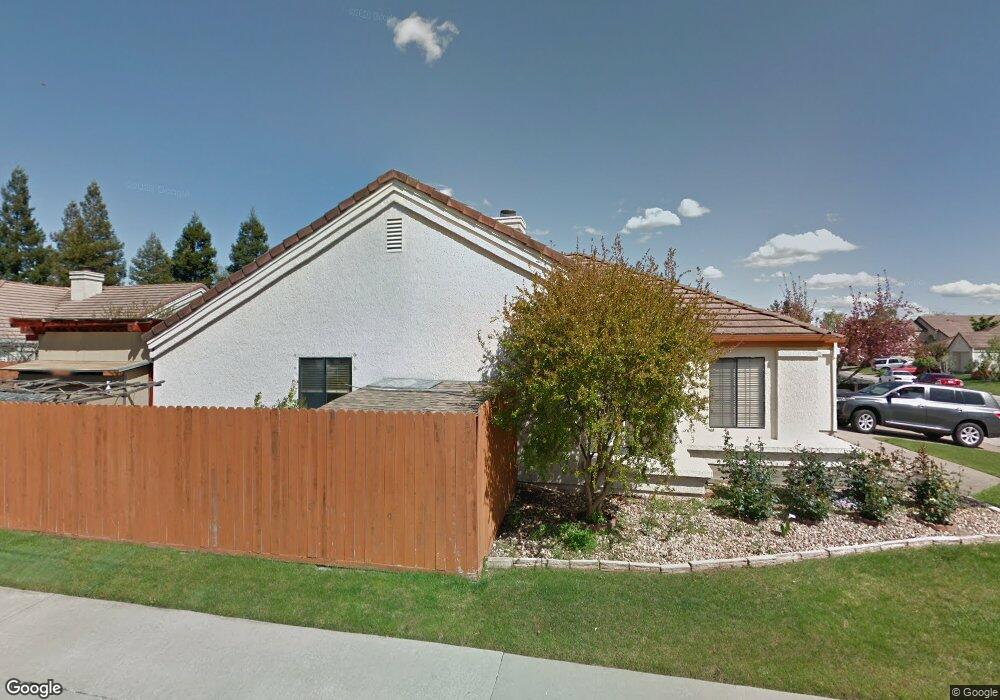
5101 Dipper Way Elk Grove, CA 95758
North West Elk Grove NeighborhoodEstimated Value: $467,000 - $565,000
3
Beds
2
Baths
1,677
Sq Ft
$315/Sq Ft
Est. Value
About This Home
This home is located at 5101 Dipper Way, Elk Grove, CA 95758 and is currently estimated at $528,056, approximately $314 per square foot. 5101 Dipper Way is a home located in Sacramento County with nearby schools including Marion Mix Elementary School, Harriet G. Eddy Middle School, and Laguna Creek High School.
Ownership History
Date
Name
Owned For
Owner Type
Purchase Details
Closed on
Aug 19, 2015
Sold by
Tran Tri Kiem and Tran Nhan Kiem
Bought by
Tran Nhan K
Current Estimated Value
Purchase Details
Closed on
Jan 31, 2004
Sold by
Huynh My Tieu
Bought by
Tran Nhan Kiem
Purchase Details
Closed on
Jan 10, 2004
Sold by
Tran Tri Kiem
Bought by
Tran Tri Kiem and Tran Nhan Kiem
Purchase Details
Closed on
Aug 20, 1997
Sold by
Holmer Michael E and Holmer Doris
Bought by
Tran Tri K
Home Financials for this Owner
Home Financials are based on the most recent Mortgage that was taken out on this home.
Original Mortgage
$90,000
Outstanding Balance
$13,383
Interest Rate
7.45%
Estimated Equity
$514,673
Purchase Details
Closed on
Aug 14, 1997
Sold by
Thomas Daniel P and Thomas Jayshree
Bought by
Holmer Michael E
Home Financials for this Owner
Home Financials are based on the most recent Mortgage that was taken out on this home.
Original Mortgage
$90,000
Outstanding Balance
$13,383
Interest Rate
7.45%
Estimated Equity
$514,673
Purchase Details
Closed on
Jan 17, 1994
Sold by
Thomas Daniel P
Bought by
Thomas Daniel P
Create a Home Valuation Report for This Property
The Home Valuation Report is an in-depth analysis detailing your home's value as well as a comparison with similar homes in the area
Home Values in the Area
Average Home Value in this Area
Purchase History
| Date | Buyer | Sale Price | Title Company |
|---|---|---|---|
| Tran Nhan K | -- | None Available | |
| Tran Nhan K | -- | None Available | |
| Tran Nhan Kiem | -- | -- | |
| Tran Tri Kiem | -- | -- | |
| Tran Tri Kien | -- | -- | |
| Tran Tri K | $120,000 | Chicago Title Co | |
| Holmer Michael E | $93,900 | -- | |
| Thomas Daniel P | -- | -- |
Source: Public Records
Mortgage History
| Date | Status | Borrower | Loan Amount |
|---|---|---|---|
| Open | Tran Tri K | $90,000 |
Source: Public Records
Tax History Compared to Growth
Tax History
| Year | Tax Paid | Tax Assessment Tax Assessment Total Assessment is a certain percentage of the fair market value that is determined by local assessors to be the total taxable value of land and additions on the property. | Land | Improvement |
|---|---|---|---|---|
| 2025 | $3,952 | $332,640 | $94,699 | $237,941 |
| 2024 | $3,952 | $326,119 | $92,843 | $233,276 |
| 2023 | $3,843 | $319,725 | $91,023 | $228,702 |
| 2022 | $3,780 | $313,457 | $89,239 | $224,218 |
| 2021 | $3,709 | $307,312 | $87,490 | $219,822 |
| 2020 | $3,655 | $304,161 | $86,593 | $217,568 |
| 2019 | $3,585 | $298,198 | $84,896 | $213,302 |
| 2018 | $3,489 | $292,352 | $83,232 | $209,120 |
| 2017 | $3,422 | $286,620 | $81,600 | $205,020 |
| 2016 | $3,264 | $281,000 | $80,000 | $201,000 |
| 2015 | $2,015 | $159,410 | $53,134 | $106,276 |
| 2014 | $1,992 | $156,289 | $52,094 | $104,195 |
Source: Public Records
Map
Nearby Homes
- 5013 Efthemia Way
- 8959 Boreal Way
- Residence 2125 Plan at Tegan Estates
- Residence 1845 Plan at Tegan Estates
- Residence 1960 Plan at Tegan Estates
- Residence 1850 Plan at Tegan Estates
- 9121 Hensley Way
- 5161 Saint Edwards Way
- 9139 Hensley Way
- 9144 Hensley Way
- 9105 Turnbull Ct
- 9186 Jamel Ct
- 0 Elliott Ranch Rd Unit 225131105
- 8944 Warmsprings St
- 5201 Laguna Oaks Dr Unit 96
- 5201 Laguna Oaks Dr Unit 70
- 5201 Laguna Oaks Dr Unit 5
- 5310 Privet Ln
- 8741 Noble Fir Ln
- 9313 Edisto Way
- 5105 Dipper Way
- 5006 Efthemia Way
- 5109 Dipper Way
- 5001 Efthemia Way
- 4917 Efthemia Way
- 5100 Dipper Way
- 5005 Efthemia Way
- 4913 Efthemia Way
- 5108 Dipper Way
- 5113 Dipper Way
- 9008 Chaff Ct
- 5009 Efthemia Way
- 5014 Efthemia Way
- 4909 Efthemia Way
- 5112 Dipper Way
- 9004 Chaff Ct
- 5117 Dipper Way
- 9012 Chaff Ct
- 4905 Efthemia Way