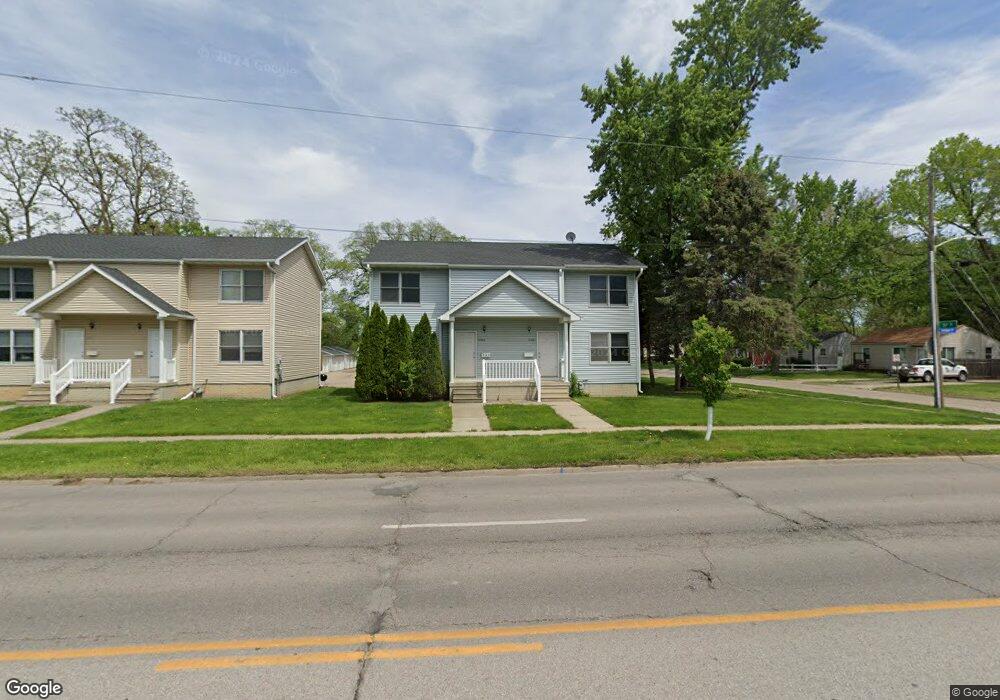
5101 Hickman Rd Des Moines, IA 50310
Merle Hay NeighborhoodEstimated Value: $229,000 - $391,000
4
Beds
4
Baths
2,184
Sq Ft
$145/Sq Ft
Est. Value
About This Home
This home is located at 5101 Hickman Rd, Des Moines, IA 50310 and is currently estimated at $317,000, approximately $145 per square foot. 5101 Hickman Rd is a home located in Polk County with nearby schools including Hillis Elementary School, Meredith Middle School, and Hoover High School.
Ownership History
Date
Name
Owned For
Owner Type
Purchase Details
Closed on
Dec 31, 2019
Sold by
Uitermarket Dwight C and Uitermarket Dwight Revocable T
Bought by
Soper Investment Properties Llc
Current Estimated Value
Home Financials for this Owner
Home Financials are based on the most recent Mortgage that was taken out on this home.
Original Mortgage
$698,715
Outstanding Balance
$616,018
Interest Rate
3.6%
Mortgage Type
Commercial
Estimated Equity
-$299,018
Create a Home Valuation Report for This Property
The Home Valuation Report is an in-depth analysis detailing your home's value as well as a comparison with similar homes in the area
Home Values in the Area
Average Home Value in this Area
Purchase History
| Date | Buyer | Sale Price | Title Company |
|---|---|---|---|
| Soper Investment Properties Llc | $690,000 | None Available |
Source: Public Records
Mortgage History
| Date | Status | Borrower | Loan Amount |
|---|---|---|---|
| Open | Soper Investment Properties Llc | $698,715 |
Source: Public Records
Tax History Compared to Growth
Tax History
| Year | Tax Paid | Tax Assessment Tax Assessment Total Assessment is a certain percentage of the fair market value that is determined by local assessors to be the total taxable value of land and additions on the property. | Land | Improvement |
|---|---|---|---|---|
| 2025 | $5,372 | $307,100 | $49,100 | $258,000 |
| 2024 | $5,372 | $273,100 | $42,800 | $230,300 |
| 2023 | $5,368 | $273,100 | $42,800 | $230,300 |
| 2022 | $5,328 | $227,800 | $37,200 | $190,600 |
| 2021 | $5,412 | $227,800 | $37,200 | $190,600 |
| 2020 | $5,624 | $216,900 | $35,300 | $181,600 |
| 2019 | $5,238 | $216,900 | $35,300 | $181,600 |
| 2018 | $5,184 | $194,900 | $30,900 | $164,000 |
| 2017 | $4,708 | $194,900 | $30,900 | $164,000 |
| 2016 | $4,588 | $174,100 | $27,300 | $146,800 |
| 2015 | $4,588 | $174,100 | $27,300 | $146,800 |
| 2014 | $4,384 | $171,200 | $26,500 | $144,700 |
Source: Public Records
Map
Nearby Homes
- 2223 51st St
- 2301 50th St
- 2401 49th Place
- 1900 50th St Unit 9
- 5027 Franklin Ave
- 2520 49th St
- 2505 48th Place
- 2712 49th St
- 2021 48th St
- 4707 Franklin Ave
- 5722 Lincoln Ave
- 2508 46th St
- 1804 47th St
- 4509 Hickman Rd
- 1705 56th St
- 1828 46th St
- 5616 New York Ave
- 4924 Urbandale Ave
- 1716 47th St
- 2409 45th St