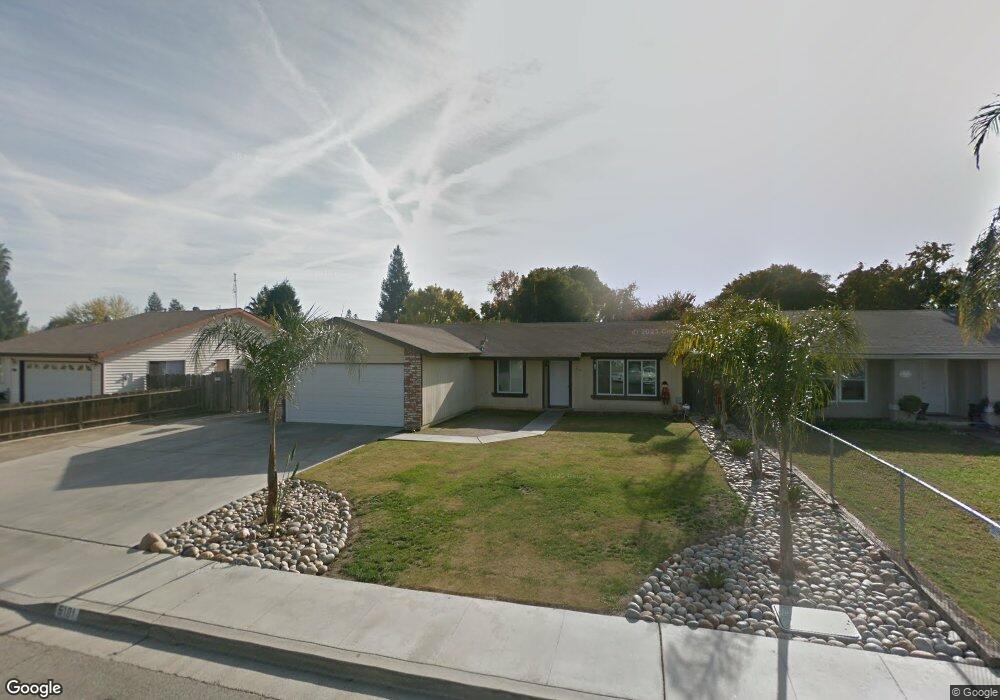
5101 W Dartmouth Ave Visalia, CA 93277
Estimated Value: $307,773 - $331,000
3
Beds
2
Baths
1,288
Sq Ft
$248/Sq Ft
Est. Value
About This Home
This home is located at 5101 W Dartmouth Ave, Visalia, CA 93277 and is currently estimated at $319,943, approximately $248 per square foot. 5101 W Dartmouth Ave is a home located in Tulare County with nearby schools including Veva Blunt Elementary School, La Joya Middle School, and El Diamante High School.
Ownership History
Date
Name
Owned For
Owner Type
Purchase Details
Closed on
Oct 15, 2008
Sold by
Us Bank National Association
Bought by
Aguilera Raul A and Aguilera Carina
Current Estimated Value
Home Financials for this Owner
Home Financials are based on the most recent Mortgage that was taken out on this home.
Original Mortgage
$114,262
Interest Rate
6.16%
Mortgage Type
FHA
Purchase Details
Closed on
Sep 4, 2008
Sold by
Terrell Richard L
Bought by
U S Bank Na and Mastr Asset Backed Securities Trust 2007
Home Financials for this Owner
Home Financials are based on the most recent Mortgage that was taken out on this home.
Original Mortgage
$114,262
Interest Rate
6.16%
Mortgage Type
FHA
Purchase Details
Closed on
Nov 21, 2002
Sold by
Terrell Stella R
Bought by
Terrell Richard L and Terrell Stella R
Home Financials for this Owner
Home Financials are based on the most recent Mortgage that was taken out on this home.
Original Mortgage
$81,000
Interest Rate
6.12%
Create a Home Valuation Report for This Property
The Home Valuation Report is an in-depth analysis detailing your home's value as well as a comparison with similar homes in the area
Home Values in the Area
Average Home Value in this Area
Purchase History
| Date | Buyer | Sale Price | Title Company |
|---|---|---|---|
| Aguilera Raul A | $115,000 | Chicago Title Company | |
| U S Bank Na | $146,246 | None Available | |
| Terrell Richard L | -- | First American Title Co |
Source: Public Records
Mortgage History
| Date | Status | Borrower | Loan Amount |
|---|---|---|---|
| Previous Owner | Aguilera Raul A | $114,262 | |
| Previous Owner | Terrell Richard L | $81,000 |
Source: Public Records
Tax History Compared to Growth
Tax History
| Year | Tax Paid | Tax Assessment Tax Assessment Total Assessment is a certain percentage of the fair market value that is determined by local assessors to be the total taxable value of land and additions on the property. | Land | Improvement |
|---|---|---|---|---|
| 2025 | $1,567 | $148,091 | $57,951 | $90,140 |
| 2024 | $1,567 | $145,188 | $56,815 | $88,373 |
| 2023 | $1,524 | $142,342 | $55,701 | $86,641 |
| 2022 | $1,456 | $139,552 | $54,609 | $84,943 |
| 2021 | $1,458 | $136,815 | $53,538 | $83,277 |
| 2020 | $1,442 | $135,412 | $52,989 | $82,423 |
| 2019 | $1,405 | $132,757 | $51,950 | $80,807 |
| 2018 | $1,365 | $130,154 | $50,931 | $79,223 |
| 2017 | $1,355 | $127,602 | $49,932 | $77,670 |
| 2016 | $1,326 | $125,100 | $48,953 | $76,147 |
| 2015 | $1,288 | $123,221 | $48,218 | $75,003 |
| 2014 | $1,288 | $120,807 | $47,273 | $73,534 |
Source: Public Records
Map
Nearby Homes
- 4747 W Iris Ave
- 4737 W Iris Ave
- 1233 S Kent St
- 4615 W Feemster Ave
- 5505 W Tulare Ave Unit 24
- 5505 W Tulare Ave Unit 406
- 5505 W Tulare Ave Unit 113
- 5505 W Tulare Ave Unit 378
- 5505 W Tulare Ave Unit 15
- 5505 W Tulare Ave Unit 64
- 5505 W Tulare Ave Unit 379
- 4614 W Howard Ave
- 4438 W Feemster Ave
- 5541 W Walnut Ave
- 5746 W Judy Ct
- 924 S Jennie St
- 5730 W Laura Ct
- 844 S Linwood St
- 4746 W Ashland Ave
- 1633 S Chinowth St
- 5111 W Dartmouth Ave
- 5041 W Dartmouth Ave
- 1539 S Parkwood St
- 5124 W Feemster Ct
- 5123 W Dartmouth Ave
- 5102 W Dartmouth Ave
- 5044 W Dartmouth Ave
- 5110 W Dartmouth Ave
- 5140 W Feemster Ct
- 5135 W Dartmouth Ave
- 1545 S Parkwood St
- 5036 W Dartmouth Ave
- 5125 W Feemster Ct
- 5118 W Dartmouth Ave
- 5015 W Dartmouth Ave
- 5128 W Dartmouth Ave
- 1542 S Parkwood St
- 1550 S Parkwood St
- 5148 W Feemster Ct
- 5147 W Dartmouth Ave