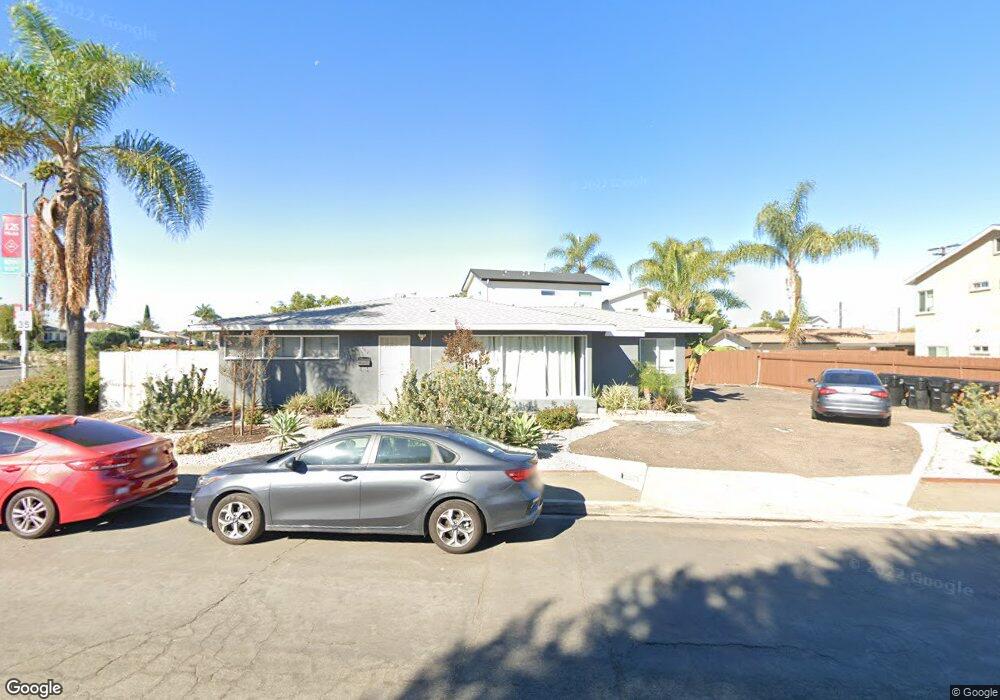
5102 Ewing St San Diego, CA 92115
College East NeighborhoodEstimated Value: $1,176,000 - $1,687,000
7
Beds
3
Baths
2,033
Sq Ft
$717/Sq Ft
Est. Value
About This Home
This home is located at 5102 Ewing St, San Diego, CA 92115 and is currently estimated at $1,457,460, approximately $716 per square foot. 5102 Ewing St is a home located in San Diego County with nearby schools including Hardy Elementary School, Clay Elementary School, and Lewis Middle School.
Ownership History
Date
Name
Owned For
Owner Type
Purchase Details
Closed on
Feb 20, 2019
Sold by
Babrov Nada
Bought by
Babrov Nada and Karr Ruth
Current Estimated Value
Purchase Details
Closed on
Nov 29, 2018
Sold by
3W Properties Llc
Bought by
Babrov Nada
Home Financials for this Owner
Home Financials are based on the most recent Mortgage that was taken out on this home.
Original Mortgage
$543,750
Outstanding Balance
$480,011
Interest Rate
4.9%
Mortgage Type
New Conventional
Estimated Equity
$977,449
Purchase Details
Closed on
Mar 26, 2013
Sold by
Canepa William and Gaskins William
Bought by
3W Properties Llc
Home Financials for this Owner
Home Financials are based on the most recent Mortgage that was taken out on this home.
Original Mortgage
$40,000
Interest Rate
3.49%
Mortgage Type
Purchase Money Mortgage
Purchase Details
Closed on
Mar 7, 2013
Sold by
Canepa Cathie A
Bought by
Canepa William
Home Financials for this Owner
Home Financials are based on the most recent Mortgage that was taken out on this home.
Original Mortgage
$40,000
Interest Rate
3.49%
Mortgage Type
Purchase Money Mortgage
Purchase Details
Closed on
Jun 25, 2011
Sold by
Canepa Kyle W
Bought by
3W Properties Llc
Purchase Details
Closed on
Dec 7, 2010
Sold by
Wakefield Robert and Wakefield Susan
Bought by
Canepa Kyle William
Home Financials for this Owner
Home Financials are based on the most recent Mortgage that was taken out on this home.
Original Mortgage
$422,063
Interest Rate
4.17%
Mortgage Type
Purchase Money Mortgage
Purchase Details
Closed on
Nov 14, 2005
Sold by
Sells Ian
Bought by
Wakefield Robert and Wakefield Susan
Home Financials for this Owner
Home Financials are based on the most recent Mortgage that was taken out on this home.
Original Mortgage
$643,000
Interest Rate
6.3%
Mortgage Type
Purchase Money Mortgage
Purchase Details
Closed on
Aug 20, 2005
Sold by
Sells Andrew J and Sells Miriam F
Bought by
Sells Ian
Purchase Details
Closed on
Dec 20, 2004
Sold by
Groover Theron W
Bought by
Sells Andrew J and Sells Miriam F
Home Financials for this Owner
Home Financials are based on the most recent Mortgage that was taken out on this home.
Original Mortgage
$373,150
Interest Rate
6.7%
Mortgage Type
Purchase Money Mortgage
Purchase Details
Closed on
Nov 25, 1998
Sold by
Groover Theron W and Groover Eugenia O
Bought by
Groover Theron W and Grover Eugenia O
Create a Home Valuation Report for This Property
The Home Valuation Report is an in-depth analysis detailing your home's value as well as a comparison with similar homes in the area
Home Values in the Area
Average Home Value in this Area
Purchase History
| Date | Buyer | Sale Price | Title Company |
|---|---|---|---|
| Babrov Nada | -- | None Available | |
| Babrov Nada | $750,000 | Chicago Title Company | |
| 3W Properties Llc | -- | None Available | |
| Canepa William | -- | Chicago Title Company | |
| Gaskins William Luke | -- | Chicago Title Company | |
| 3W Properties Llc | -- | None Available | |
| Canepa Kyle William | $422,500 | Lawyers Title Sd | |
| Wakefield Robert | $715,000 | Commonwealth Land Title Co | |
| Sells Ian | -- | -- | |
| Sells Andrew J | $439,000 | First American Title | |
| Groover Theron W | -- | -- |
Source: Public Records
Mortgage History
| Date | Status | Borrower | Loan Amount |
|---|---|---|---|
| Open | Babrov Nada | $543,750 | |
| Previous Owner | 3W Properties Llc | $40,000 | |
| Previous Owner | Gaskins William Luke | $326,250 | |
| Previous Owner | Canepa Kyle William | $422,063 | |
| Previous Owner | Wakefield Robert | $643,000 | |
| Previous Owner | Sells Andrew J | $373,150 |
Source: Public Records
Tax History Compared to Growth
Tax History
| Year | Tax Paid | Tax Assessment Tax Assessment Total Assessment is a certain percentage of the fair market value that is determined by local assessors to be the total taxable value of land and additions on the property. | Land | Improvement |
|---|---|---|---|---|
| 2025 | $10,108 | $836,633 | $515,387 | $321,246 |
| 2024 | $10,108 | $820,230 | $505,282 | $314,948 |
| 2023 | $9,885 | $804,148 | $495,375 | $308,773 |
| 2022 | $9,622 | $788,381 | $485,662 | $302,719 |
| 2021 | $9,557 | $772,924 | $476,140 | $296,784 |
| 2020 | $9,441 | $764,999 | $471,258 | $293,741 |
| 2019 | $9,273 | $750,000 | $462,018 | $287,982 |
| 2018 | $5,505 | $465,912 | $287,013 | $178,899 |
| 2017 | $5,374 | $456,778 | $281,386 | $175,392 |
| 2016 | $5,288 | $447,822 | $275,869 | $171,953 |
| 2015 | $5,211 | $441,097 | $271,726 | $169,371 |
| 2014 | $5,129 | $432,458 | $266,404 | $166,054 |
Source: Public Records
Map
Nearby Homes
- 6411 Gary Ct
- 6486 Montezuma Rd
- 4917 Rockford Dr
- 5092 Catoctin Dr
- 4749 Choctaw Dr
- 4860 Rolando Ct Unit 25
- 4860 Rolando Ct Unit 44
- 4860 Rolando Ct Unit 42
- 4860 Rolando Ct Unit 29
- 4860 Rolando Ct Unit 81
- 4727 Choctaw Dr
- 5157 Catoctin Dr
- 4926 Cresita Dr
- 6457 Julie St
- 6496 Cleo St
- 4777 Seminole Dr Unit 118
- 6650 Amherst St Unit 14A
- 4805 Rolando Blvd
- 4733 Soria Dr
- 6651 Reservoir Ln
- 6332 Montezuma Rd
- 5102 Tipton St
- 5106 Tipton St
- 6328 Montezuma Rd
- 5107/5109 Ewing St
- 6344 Montezuma Rd
- 5111 Ewing St
- 5107 Ewing St
- 6326 Montezuma Rd
- 5115/5117 Ewing St
- 5116 Tipton St
- 5120 Ewing St
- 5103 Tipton St
- 5075 Art St Unit 77
- 6322 Montezuma Rd
- 5111 Tipton St
- 5111-13 Tipton St
- 5115 Ewing St
- 5135 63rd St
- 5061 Art St