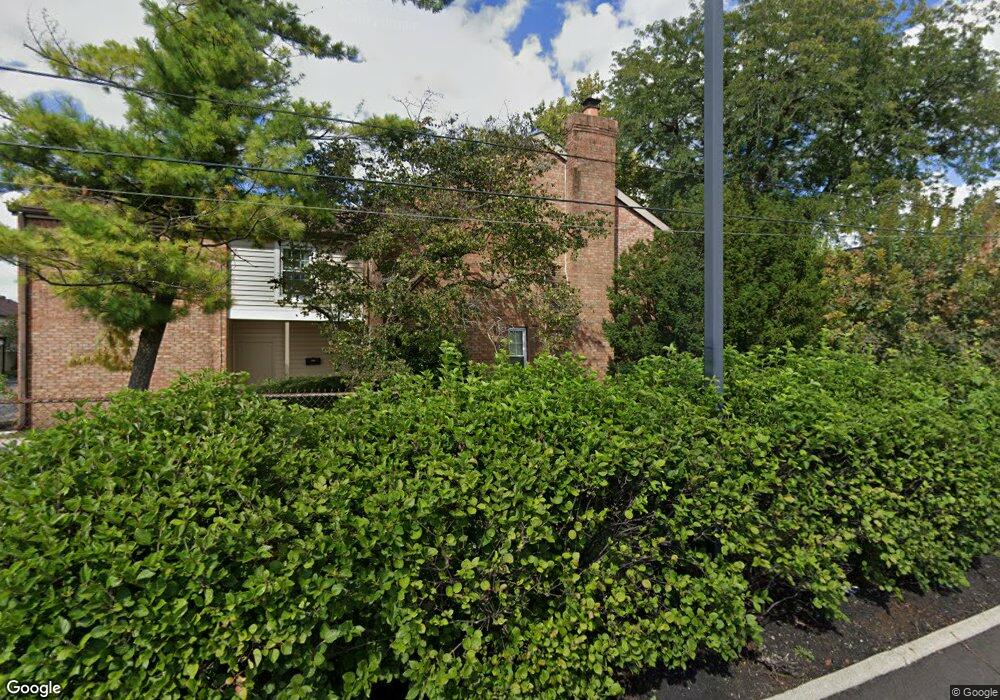
5102 Ranstead Ct Unit 2 Columbus, OH 43220
Knolls West NeighborhoodEstimated Value: $268,000 - $293,000
3
Beds
3
Baths
1,879
Sq Ft
$147/Sq Ft
Est. Value
About This Home
This home is located at 5102 Ranstead Ct Unit 2, Columbus, OH 43220 and is currently estimated at $276,085, approximately $146 per square foot. 5102 Ranstead Ct Unit 2 is a home located in Franklin County with nearby schools including Winterset Elementary School, Ridgeview Middle School, and Centennial High School.
Ownership History
Date
Name
Owned For
Owner Type
Purchase Details
Closed on
Aug 2, 2016
Sold by
Shaffer David A
Bought by
Campell Nora
Current Estimated Value
Purchase Details
Closed on
Sep 23, 2004
Sold by
Farmer Jeanne S
Bought by
Shaffer David A
Purchase Details
Closed on
May 20, 1999
Sold by
Schweickart Charles W and Schweickart Dorothy M
Bought by
Farmer Jeanne S and Jeanne S Farmer Trust
Purchase Details
Closed on
Oct 9, 1992
Bought by
Schweickart Charles W
Create a Home Valuation Report for This Property
The Home Valuation Report is an in-depth analysis detailing your home's value as well as a comparison with similar homes in the area
Home Values in the Area
Average Home Value in this Area
Purchase History
| Date | Buyer | Sale Price | Title Company |
|---|---|---|---|
| Campell Nora | $143,000 | Nordic Title Box | |
| Shaffer David A | $143,000 | Title First | |
| Farmer Jeanne S | $110,000 | Chicago Title | |
| Schweickart Charles W | -- | -- |
Source: Public Records
Tax History Compared to Growth
Tax History
| Year | Tax Paid | Tax Assessment Tax Assessment Total Assessment is a certain percentage of the fair market value that is determined by local assessors to be the total taxable value of land and additions on the property. | Land | Improvement |
|---|---|---|---|---|
| 2024 | $2,823 | $72,700 | $14,000 | $58,700 |
| 2023 | $2,815 | $72,695 | $14,000 | $58,695 |
| 2022 | $2,589 | $58,670 | $7,110 | $51,560 |
| 2021 | $2,594 | $58,670 | $7,110 | $51,560 |
| 2020 | $2,597 | $58,670 | $7,110 | $51,560 |
| 2019 | $2,104 | $43,440 | $5,250 | $38,190 |
| 2018 | $2,340 | $43,440 | $5,250 | $38,190 |
| 2017 | $2,473 | $43,440 | $5,250 | $38,190 |
| 2016 | $2,843 | $42,920 | $5,010 | $37,910 |
| 2015 | $2,581 | $42,920 | $5,010 | $37,910 |
| 2014 | $2,587 | $42,920 | $5,010 | $37,910 |
| 2013 | $1,381 | $45,150 | $5,250 | $39,900 |
Source: Public Records
Map
Nearby Homes
- 1739 Paula Dr Unit 1739
- 5111 Schuylkill St
- 5111 Portland St
- 1865 Willoway Cir N Unit 1865
- 1558 Denbigh Dr
- 1835 Willoway Cir N
- 4924 Reed Rd Unit B
- 5268 Captains Ct
- 1466 Weybridge Rd
- 1540 Slade Ave Unit 303
- 2172 Hedgerow Rd Unit 2172G
- 4818 -4820 Winterset Dr
- 4740 Merrifield Place Unit 25
- 2179 Victoria Park Dr Unit 2179
- 5363 Godown Rd
- 2236 Victoria Park Dr Unit 2236
- 5283 Ruthton Rd Unit 19
- 2165 Partlow Dr
- 2198 Sandston Rd
- 4781 Coach Rd
- 5100 Ranstead Ct
- 5104 Ranstead Ct Unit 4
- 5106 Ranstead Ct Unit 6
- 5108 Ranstead Ct
- 5103 Ranstead Ct
- 5101 Delancey St Unit 1
- 5099 Delancey St Unit 99
- 5110 Ranstead Ct
- 5105 Ranstead Ct
- 5107 Ranstead Ct
- 5112 Ranstead Ct
- 5109 Ranstead Ct Unit 9B
- 5125 Ranstead Ct
- 5114 Ranstead Ct
- 5111 Ranstead Ct
- 5105 Delancey St Unit D0305
- 5113 Ranstead Ct Unit 513
- 5107 Delancey St
- 5107 Delancey St Unit 5107