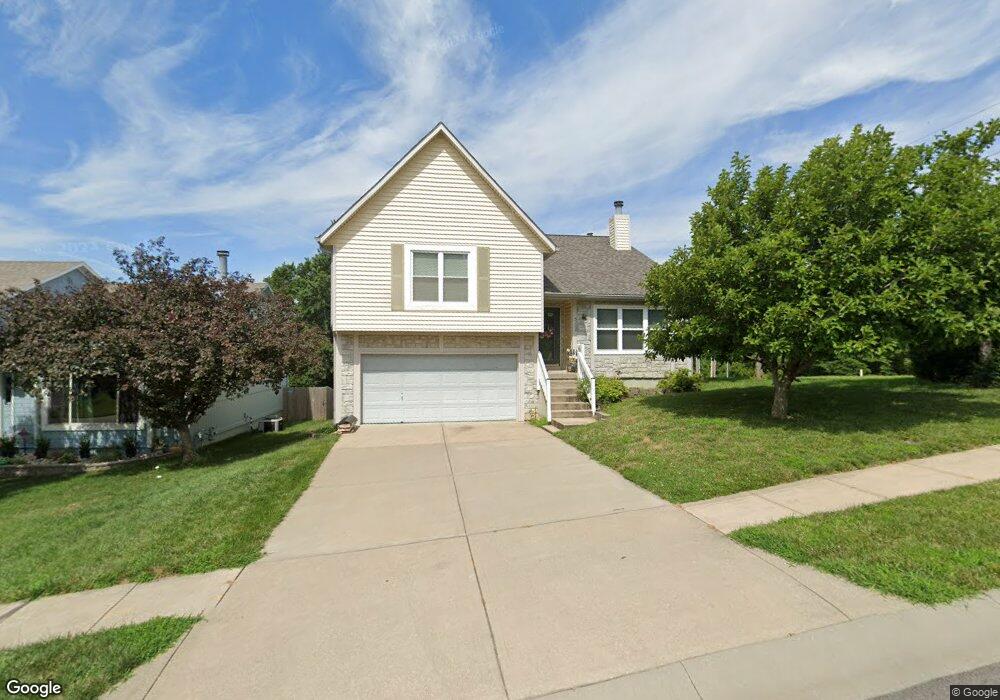
5102 Rosehill Rd Shawnee, KS 66216
Estimated Value: $356,000 - $380,000
3
Beds
3
Baths
1,526
Sq Ft
$243/Sq Ft
Est. Value
About This Home
This home is located at 5102 Rosehill Rd, Shawnee, KS 66216 and is currently estimated at $370,202, approximately $242 per square foot. 5102 Rosehill Rd is a home located in Johnson County with nearby schools including Ray Marsh Elementary School, Trailridge Middle School, and Shawnee Mission Northwest High School.
Ownership History
Date
Name
Owned For
Owner Type
Purchase Details
Closed on
Mar 29, 2005
Sold by
Riley Ivan R and Riley Tahlisha M
Bought by
Rawlings Henry J and Rawlings Shirley J
Current Estimated Value
Home Financials for this Owner
Home Financials are based on the most recent Mortgage that was taken out on this home.
Original Mortgage
$138,800
Outstanding Balance
$71,301
Interest Rate
5.71%
Mortgage Type
New Conventional
Estimated Equity
$298,901
Purchase Details
Closed on
Apr 21, 2004
Sold by
Heartland Properties Llc
Bought by
Riley Ivan R and Riley Tahlisha M
Home Financials for this Owner
Home Financials are based on the most recent Mortgage that was taken out on this home.
Original Mortgage
$163,706
Interest Rate
5.38%
Mortgage Type
FHA
Purchase Details
Closed on
Nov 25, 2003
Sold by
Hannah Phyllis D
Bought by
Heartland Properties Llc
Create a Home Valuation Report for This Property
The Home Valuation Report is an in-depth analysis detailing your home's value as well as a comparison with similar homes in the area
Home Values in the Area
Average Home Value in this Area
Purchase History
| Date | Buyer | Sale Price | Title Company |
|---|---|---|---|
| Rawlings Henry J | -- | Old Republic Title Of Kansas | |
| Riley Ivan R | -- | Columbian Title Of Johnson C | |
| Heartland Properties Llc | -- | -- |
Source: Public Records
Mortgage History
| Date | Status | Borrower | Loan Amount |
|---|---|---|---|
| Open | Rawlings Henry J | $138,800 | |
| Previous Owner | Riley Ivan R | $163,706 |
Source: Public Records
Tax History Compared to Growth
Tax History
| Year | Tax Paid | Tax Assessment Tax Assessment Total Assessment is a certain percentage of the fair market value that is determined by local assessors to be the total taxable value of land and additions on the property. | Land | Improvement |
|---|---|---|---|---|
| 2024 | $4,144 | $39,180 | $6,839 | $32,341 |
| 2023 | $3,977 | $37,099 | $6,217 | $30,882 |
| 2022 | $3,496 | $32,510 | $5,652 | $26,858 |
| 2021 | $3,282 | $28,600 | $4,915 | $23,685 |
| 2020 | $3,152 | $27,105 | $4,464 | $22,641 |
| 2019 | $3,057 | $26,266 | $4,255 | $22,011 |
| 2018 | $2,823 | $24,150 | $4,255 | $19,895 |
| 2017 | $2,771 | $23,334 | $3,871 | $19,463 |
| 2016 | $2,663 | $22,138 | $3,871 | $18,267 |
| 2015 | $2,457 | $21,241 | $3,871 | $17,370 |
| 2013 | -- | $20,401 | $3,871 | $16,530 |
Source: Public Records
Map
Nearby Homes
- 13305 W 51st St
- 5021 Bradshaw St
- 5013 Bradshaw St
- 13130 W 52nd Terrace
- 13126 W 52nd Terrace
- 13134 W 52nd Terrace
- 5504 Monrovia St
- 5407 Halsey St
- 12508 W 56th St
- 5507 Noland Rd
- 11907 W 49th Place
- 11815 W 53rd St
- 12023 W 48th St
- 13810 W 53rd St
- W 48th St
- 12809 W 57th Terrace
- 13804 W 55th Terrace
- 11403 W 51st Terrace
- 5530 Rene St
- 14105 W 48th Terrace
- 5106 Rosehill Rd
- 12706 W 51st Terrace
- 5110 Rosehill Rd
- 5101 Rosehill Rd
- 5105 Rosehill Rd
- 5109 Rosehill Rd
- 12712 W 51st St
- 12802 W 51st Terrace
- 12710 W 51st St
- 5113 Rosehill Rd
- 5120 Rosehill Rd
- 12703 W 51st St
- 12707 W 51st Terrace
- 5117 Rosehill Rd
- 12806 W 51st Terrace
- 5121 Rosehill Rd
- 12809 W 51st Terrace
- 12801 W 51st Terrace
- 5200 Rosehill Rd
- 12805 W 51st Terrace