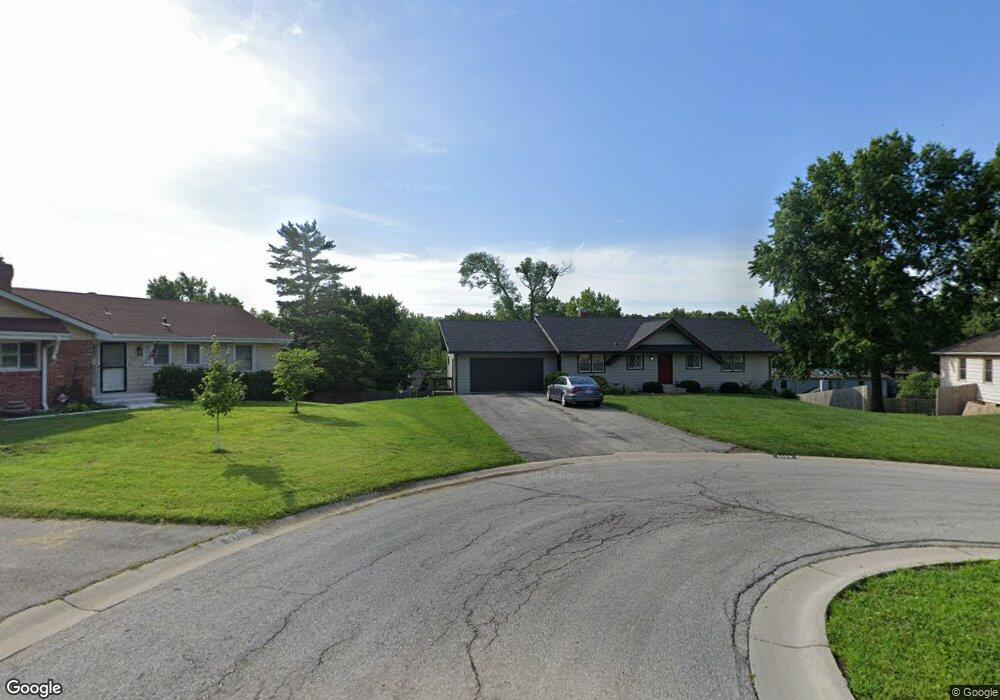
5103 Mansfield Ln Shawnee, KS 66203
Estimated Value: $344,000 - $402,000
3
Beds
3
Baths
1,196
Sq Ft
$311/Sq Ft
Est. Value
About This Home
This home is located at 5103 Mansfield Ln, Shawnee, KS 66203 and is currently estimated at $371,966, approximately $311 per square foot. 5103 Mansfield Ln is a home located in Johnson County with nearby schools including Bluejacket / Flint Elementary, Hocker Grove Middle School, and Shawnee Mission North High School.
Ownership History
Date
Name
Owned For
Owner Type
Purchase Details
Closed on
Mar 15, 2018
Sold by
Joyce Joseph J and Joyce Joseph M
Bought by
Joyce Marcella J
Current Estimated Value
Purchase Details
Closed on
Jul 25, 2009
Sold by
Henke Mary R and Cahill Marsha K
Bought by
Joyce Marcella J and Joyce Joseph J
Purchase Details
Closed on
Dec 27, 2007
Sold by
Henke Albert C and Henke Mary R
Bought by
Henke Mary R and Cahill Marsha K
Create a Home Valuation Report for This Property
The Home Valuation Report is an in-depth analysis detailing your home's value as well as a comparison with similar homes in the area
Home Values in the Area
Average Home Value in this Area
Purchase History
| Date | Buyer | Sale Price | Title Company |
|---|---|---|---|
| Joyce Marcella J | -- | None Available | |
| Joyce Marcella J | -- | First American Title Ins Co | |
| Henke Mary R | -- | None Available |
Source: Public Records
Tax History Compared to Growth
Tax History
| Year | Tax Paid | Tax Assessment Tax Assessment Total Assessment is a certain percentage of the fair market value that is determined by local assessors to be the total taxable value of land and additions on the property. | Land | Improvement |
|---|---|---|---|---|
| 2024 | $4,209 | $39,779 | $8,179 | $31,600 |
| 2023 | $4,100 | $38,238 | $8,209 | $30,029 |
| 2022 | $3,455 | $32,131 | $7,466 | $24,665 |
| 2021 | $3,338 | $29,095 | $6,487 | $22,608 |
| 2020 | $3,233 | $27,807 | $5,887 | $21,920 |
| 2019 | $2,855 | $24,518 | $4,672 | $19,846 |
| 2018 | $2,699 | $23,080 | $4,672 | $18,408 |
| 2017 | $2,508 | $21,102 | $4,242 | $16,860 |
| 2016 | $2,499 | $20,757 | $4,242 | $16,515 |
| 2015 | $2,280 | $19,711 | $4,242 | $15,469 |
| 2013 | -- | $17,687 | $4,242 | $13,445 |
Source: Public Records
Map
Nearby Homes
- 10511 W 49th Place
- 10116 W 52nd Terrace
- 0 W 49th St
- 9929 W 52nd St
- 5308 Mcanany Dr
- 11403 W 51st Terrace
- Ashwood Plan at Bristol Highlands - North
- The Fleetwood Plan at Bristol Highlands - The Villas
- Cypress II Plan at Bristol Highlands - North
- The Fleetwood Plan at Bristol Highlands - The Manors
- The Brentwood Plan at Bristol Highlands - The Villas
- Yorkshire V Plan at Bristol Highlands - North
- The Kirkwood Plan at Bristol Highlands - The Villas
- 8013 Payne St
- The Rockwood Plan at Bristol Highlands - The Villas
- Magnolia Plan at Bristol Highlands - North
- 9719 W 53rd St
- 5003 Knox Ave
- 11002 W 55th Terrace
- 5405 Oliver St
- 5109 Mansfield Ln
- 5110 Ballentine St
- 5106 Ballentine St
- 5105 Mansfield Ln
- 5114 Ballentine St
- 5102 Ballentine St
- 5100 Mansfield Ln
- 5115 Mansfield Ln
- 5100 Ballentine St
- 5118 Ballentine St
- 5104 Mansfield Ln
- 5102 Mansfield Ln
- 5133 Mansfield Ln
- 5111 Ballentine Ave
- 5111 Ballentine St
- 5115 Ballentine St
- 5118 Mansfield Ln
- 5122 Ballentine St
- 5107 Ballentine St
- 5119 Ballentine St