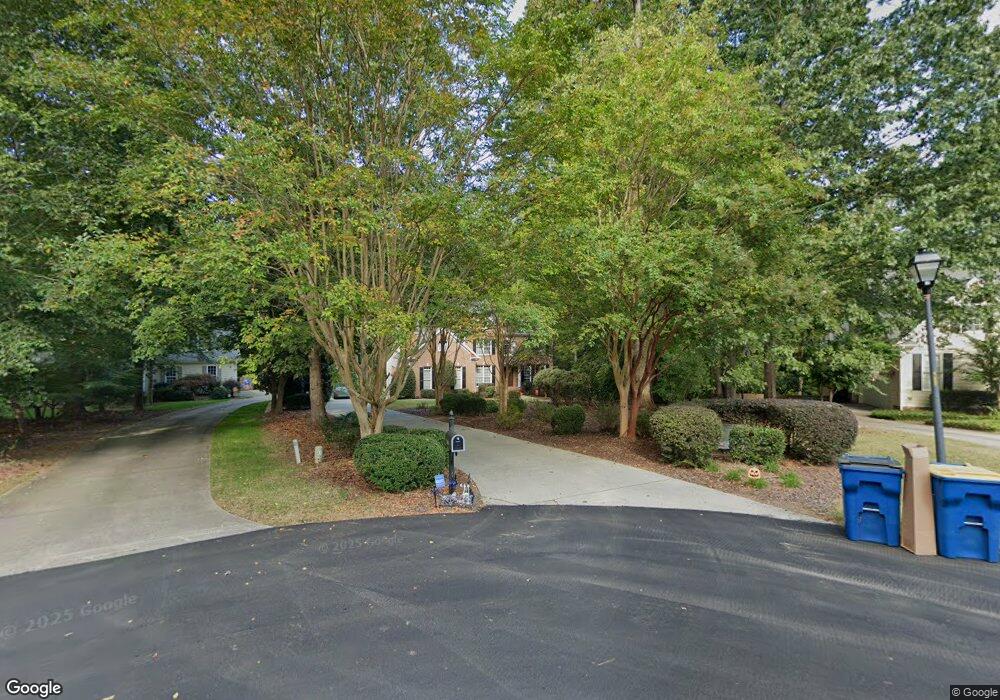
5105 Indigo Moon Way Raleigh, NC 27613
Falls Lake NeighborhoodEstimated Value: $847,000 - $904,000
5
Beds
5
Baths
3,200
Sq Ft
$273/Sq Ft
Est. Value
About This Home
This home is located at 5105 Indigo Moon Way, Raleigh, NC 27613 and is currently estimated at $874,031, approximately $273 per square foot. 5105 Indigo Moon Way is a home located in Wake County with nearby schools including Pine Hollow Middle School, Leesville Road High School, and The Franciscan School.
Ownership History
Date
Name
Owned For
Owner Type
Purchase Details
Closed on
Feb 10, 2006
Sold by
Phillips Joseph A and Phillips Elizabeth S
Bought by
Macemore Kyle S and Macemore Natalie Y
Current Estimated Value
Home Financials for this Owner
Home Financials are based on the most recent Mortgage that was taken out on this home.
Original Mortgage
$349,600
Outstanding Balance
$196,111
Interest Rate
6.14%
Mortgage Type
Fannie Mae Freddie Mac
Estimated Equity
$677,920
Purchase Details
Closed on
Oct 25, 2001
Sold by
Freeman Wade and Freeman Carol L
Bought by
Phillips Joseph A and Phillips Elizabeth S
Home Financials for this Owner
Home Financials are based on the most recent Mortgage that was taken out on this home.
Original Mortgage
$372,152
Interest Rate
6.85%
Purchase Details
Closed on
Feb 20, 2001
Sold by
Bartons Creek Bluffs Llc
Bought by
Freeman Wade and Freeman Carol L
Home Financials for this Owner
Home Financials are based on the most recent Mortgage that was taken out on this home.
Original Mortgage
$278,000
Interest Rate
7.06%
Create a Home Valuation Report for This Property
The Home Valuation Report is an in-depth analysis detailing your home's value as well as a comparison with similar homes in the area
Home Values in the Area
Average Home Value in this Area
Purchase History
| Date | Buyer | Sale Price | Title Company |
|---|---|---|---|
| Macemore Kyle S | $437,000 | None Available | |
| Phillips Joseph A | $372,500 | -- | |
| Freeman Wade | $74,500 | -- |
Source: Public Records
Mortgage History
| Date | Status | Borrower | Loan Amount |
|---|---|---|---|
| Open | Macemore Kyle S | $349,600 | |
| Previous Owner | Phillips Joseph A | $372,152 | |
| Previous Owner | Freeman Wade | $278,000 |
Source: Public Records
Tax History Compared to Growth
Tax History
| Year | Tax Paid | Tax Assessment Tax Assessment Total Assessment is a certain percentage of the fair market value that is determined by local assessors to be the total taxable value of land and additions on the property. | Land | Improvement |
|---|---|---|---|---|
| 2025 | $4,873 | $758,732 | $120,000 | $638,732 |
| 2024 | $4,732 | $758,732 | $120,000 | $638,732 |
| 2023 | $3,826 | $488,176 | $100,000 | $388,176 |
| 2022 | $3,546 | $488,176 | $100,000 | $388,176 |
| 2021 | $3,450 | $488,176 | $100,000 | $388,176 |
| 2020 | $3,393 | $488,176 | $100,000 | $388,176 |
| 2019 | $3,345 | $407,137 | $110,000 | $297,137 |
| 2018 | $3,075 | $407,137 | $110,000 | $297,137 |
| 2017 | $2,915 | $407,137 | $110,000 | $297,137 |
| 2016 | $2,856 | $407,137 | $110,000 | $297,137 |
| 2015 | $3,286 | $470,227 | $106,000 | $364,227 |
| 2014 | -- | $470,227 | $106,000 | $364,227 |
Source: Public Records
Map
Nearby Homes
- 5020 Red Cedar Rd
- 5000 Morning Edge Dr
- 5028 Morning Edge Dr
- 12316 Amoretto Way
- 5008 Dawn Piper Dr
- 5024 Dawn Piper Dr
- 5906 Dunzo Dr
- 5900 Dunzo Dr
- 5952 Dunzo Dr
- 5902 Dunzo Dr
- 5956 Dunzo Dr
- 5904 Dunzo Dr
- 6108 Dunzo Dr
- 5950 Dunzo Dr
- Harlow Plan at Bayberry
- 5216 Sutter Way
- 10917 Bayflower Way
- 10906 Bayflower Way
- 12436 Harcourt Dr
- 7862 Cape Charles Dr
- 5101 Indigo Moon Way
- 5109 Indigo Moon Way
- 5201 Indigo Moon Way
- 5100 Indigo Moon Way
- 5205 Indigo Moon Way
- 5104 Indigo Moon Way
- 4905 Sorrento Ct
- 4904 Sorrento Ct
- 5209 Indigo Moon Way
- 11137 Lakeshore Dr
- 11139 Lakeshore Dr
- 11133 Lakeshore Dr
- 5208 Indigo Moon Way
- 11143 Lakeshore Dr
- 11129 Lakeshore Dr
- 2813 Kissing Ct
- 2817 Kissing Ct
- 11416 Hickory Grove Church Rd
- 4901 Sorrento Ct
- 11201 Crestmont Dr