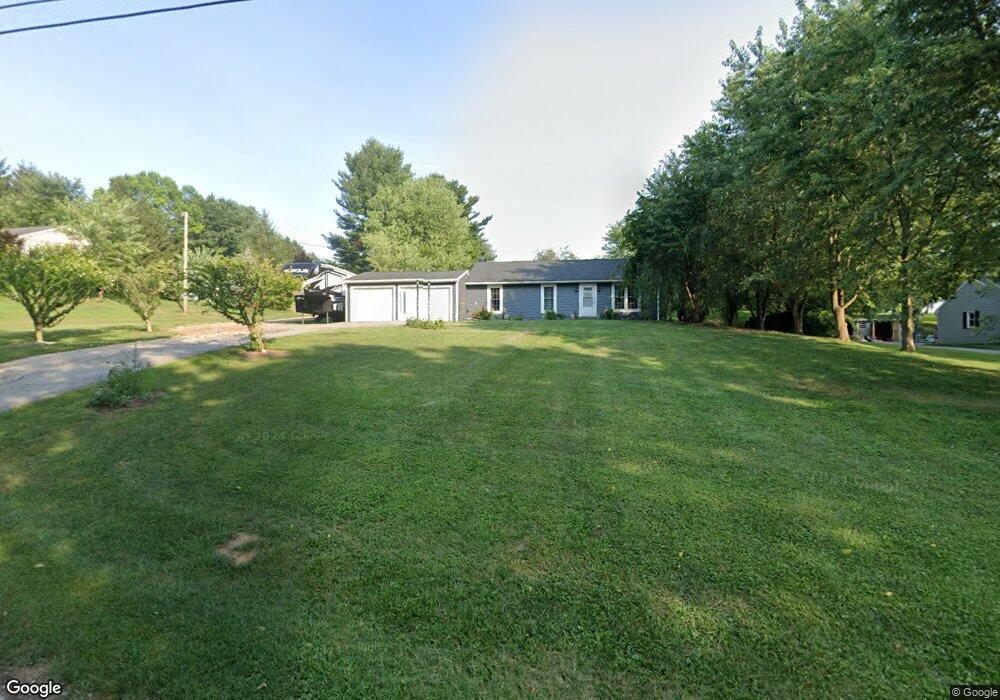
5106 Hillclimb Rd Spring Grove, PA 17362
Estimated Value: $255,000 - $281,000
3
Beds
1
Bath
1,040
Sq Ft
$259/Sq Ft
Est. Value
About This Home
This home is located at 5106 Hillclimb Rd, Spring Grove, PA 17362 and is currently estimated at $269,709, approximately $259 per square foot. 5106 Hillclimb Rd is a home located in York County with nearby schools including Susquehannock High School.
Ownership History
Date
Name
Owned For
Owner Type
Purchase Details
Closed on
May 31, 2019
Sold by
Barnhart Adrian and Barnhart Adrian E
Bought by
Barnhart Adrian and Barnhart Joyce V
Current Estimated Value
Home Financials for this Owner
Home Financials are based on the most recent Mortgage that was taken out on this home.
Original Mortgage
$169,515
Outstanding Balance
$132,138
Interest Rate
4.62%
Mortgage Type
FHA
Estimated Equity
$137,571
Purchase Details
Closed on
May 14, 2009
Sold by
Curry Jessica
Bought by
Barnhart Adrian E
Home Financials for this Owner
Home Financials are based on the most recent Mortgage that was taken out on this home.
Original Mortgage
$132,600
Interest Rate
4.85%
Mortgage Type
Purchase Money Mortgage
Purchase Details
Closed on
May 14, 2007
Sold by
Flair Christine
Bought by
Curry Jessica
Home Financials for this Owner
Home Financials are based on the most recent Mortgage that was taken out on this home.
Original Mortgage
$168,625
Interest Rate
6.18%
Mortgage Type
Purchase Money Mortgage
Create a Home Valuation Report for This Property
The Home Valuation Report is an in-depth analysis detailing your home's value as well as a comparison with similar homes in the area
Home Values in the Area
Average Home Value in this Area
Purchase History
| Date | Buyer | Sale Price | Title Company |
|---|---|---|---|
| Barnhart Adrian | -- | None Available | |
| Barnhart Adrian E | $130,000 | None Available | |
| Curry Jessica | $177,500 | None Available |
Source: Public Records
Mortgage History
| Date | Status | Borrower | Loan Amount |
|---|---|---|---|
| Open | Barnhart Adrian | $169,515 | |
| Closed | Barnhart Adrian E | $132,600 | |
| Previous Owner | Curry Jessica | $168,625 |
Source: Public Records
Tax History Compared to Growth
Tax History
| Year | Tax Paid | Tax Assessment Tax Assessment Total Assessment is a certain percentage of the fair market value that is determined by local assessors to be the total taxable value of land and additions on the property. | Land | Improvement |
|---|---|---|---|---|
| 2025 | $3,501 | $127,720 | $45,110 | $82,610 |
| 2024 | $3,501 | $127,720 | $45,110 | $82,610 |
| 2023 | $3,501 | $127,720 | $45,110 | $82,610 |
| 2022 | $3,501 | $127,720 | $45,110 | $82,610 |
| 2021 | $3,307 | $127,720 | $45,110 | $82,610 |
| 2020 | $3,307 | $127,720 | $45,110 | $82,610 |
| 2019 | $3,294 | $127,720 | $45,110 | $82,610 |
| 2018 | $3,041 | $120,090 | $45,110 | $74,980 |
| 2017 | $2,985 | $120,090 | $45,110 | $74,980 |
| 2016 | $0 | $120,090 | $45,110 | $74,980 |
| 2015 | -- | $120,090 | $45,110 | $74,980 |
| 2014 | -- | $120,090 | $45,110 | $74,980 |
Source: Public Records
Map
Nearby Homes
- 5077 Snyder Mill Rd
- 5007 Snyder Mill Rd
- 0 Emily Plan at Hills at Valley View Unit PAYK2082076
- 6320 Liam Dr
- 0 Black Cherry Plan at Hills at Valley View Unit PAYK2082012
- 0 Redbud Plan at Hills at Valley View Unit PAYK2082078
- 0 Willow Plan at Hills at Valley View Unit PAYK2082084
- Emily Plan at Hills at Valley View
- Pin Oak Plan at Hills at Valley View
- Black Cherry Plan at Hills at Valley View
- Sassafras Plan at Hills at Valley View
- Sweet Birch Plan at Hills at Valley View
- Redbud Plan at Hills at Valley View
- Willow Plan at Hills at Valley View
- White Oak Plan at Hills at Valley View
- Sugar Maple Plan at Hills at Valley View
- 0 Pin Oak Plan at Hills at Valley View Unit PAYK2082014
- 0 Sweet Birch Plan at Hills at Valley View Unit PAYK2082022
- 0 White Oak Plan at Hills at Valley View Unit PAYK2082080
- 0 Sugar Maple Plan at Hills at Valley View Unit PAYK2082020
- 5112 Hillclimb Rd
- 5098 Hillclimb Rd
- 5090 Hillclimb Rd
- 5126 Hillclimb Rd
- 5097 Hillclimb Rd
- 5082 Hillclimb Rd
- 5128 Hillclimb Rd
- 5089 Hillclimb Rd
- 5076 Hillclimb Rd
- 5144 Hillclimb Rd
- 5146 Hillclimb Rd
- 5058 Hillclimb Rd
- 5160 Hillclimb Rd
- 5059 Hillclimb Rd
- 5162 Hillclimb Rd
- 5119 Chestnut Grove Rd
- 5044 Hillclimb Rd
- 5176 Hillclimb Rd
- 5049 Hillclimb Rd
- 000 Chestnut Grove Rd