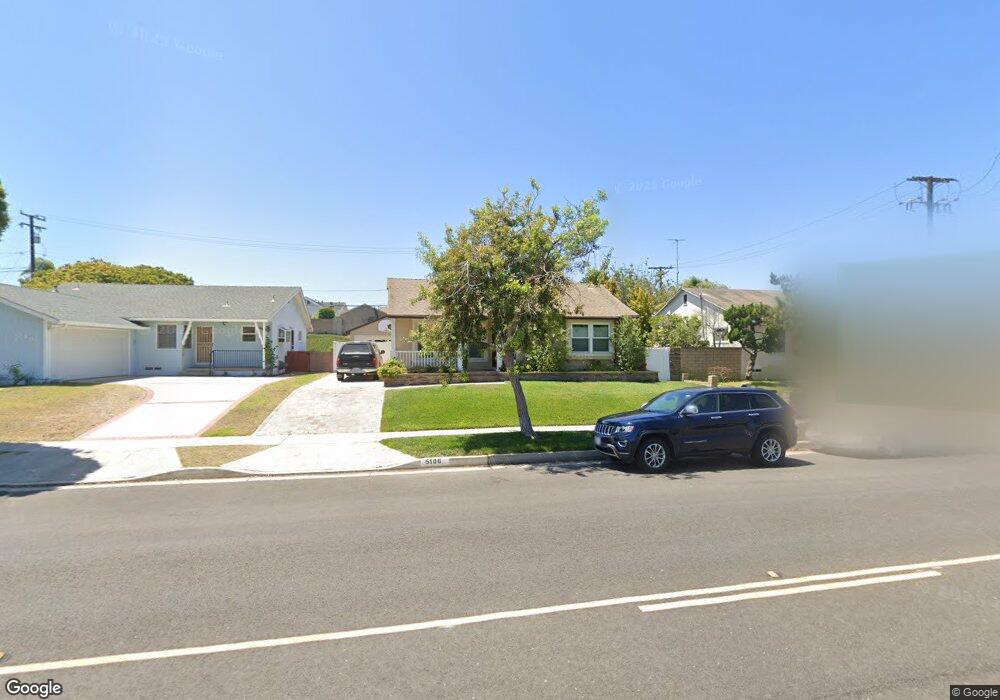
5106 W Carson St Torrance, CA 90503
Southwood NeighborhoodEstimated Value: $1,389,000 - $1,583,000
3
Beds
2
Baths
1,623
Sq Ft
$907/Sq Ft
Est. Value
About This Home
This home is located at 5106 W Carson St, Torrance, CA 90503 and is currently estimated at $1,471,709, approximately $906 per square foot. 5106 W Carson St is a home located in Los Angeles County with nearby schools including Anza Elementary School, Jefferson Middle School, and West High School.
Ownership History
Date
Name
Owned For
Owner Type
Purchase Details
Closed on
May 22, 2020
Sold by
Ludwig Michael L and Ludwig Jovona
Bought by
Ludwig Michael L and Ludwig Jovona
Current Estimated Value
Home Financials for this Owner
Home Financials are based on the most recent Mortgage that was taken out on this home.
Original Mortgage
$641,015
Outstanding Balance
$566,954
Interest Rate
3.2%
Mortgage Type
VA
Estimated Equity
$904,755
Purchase Details
Closed on
Jul 10, 2019
Sold by
Ludwig Michael L and Ludwig Jovona
Bought by
Ludwig Michael L and Ludwig Jovona
Purchase Details
Closed on
Aug 22, 2008
Sold by
Alberts Milton L and Alberts Rosalyn
Bought by
Ludwig Michael L
Home Financials for this Owner
Home Financials are based on the most recent Mortgage that was taken out on this home.
Original Mortgage
$470,000
Interest Rate
6.43%
Mortgage Type
Purchase Money Mortgage
Purchase Details
Closed on
Mar 10, 2003
Sold by
Alberts Milton L and Alberts Rosalyn
Bought by
Alberts Milton L
Create a Home Valuation Report for This Property
The Home Valuation Report is an in-depth analysis detailing your home's value as well as a comparison with similar homes in the area
Home Values in the Area
Average Home Value in this Area
Purchase History
| Date | Buyer | Sale Price | Title Company |
|---|---|---|---|
| Ludwig Michael L | -- | None Available | |
| Ludwig Michael L | -- | Ticor Title Company Of Ca | |
| Ludwig Michael L | -- | None Available | |
| Ludwig Michael L | $670,000 | Old Republic Title Company | |
| Alberts Milton L | -- | -- |
Source: Public Records
Mortgage History
| Date | Status | Borrower | Loan Amount |
|---|---|---|---|
| Open | Ludwig Michael L | $641,015 | |
| Closed | Ludwig Michael L | $470,000 |
Source: Public Records
Tax History
| Year | Tax Paid | Tax Assessment Tax Assessment Total Assessment is a certain percentage of the fair market value that is determined by local assessors to be the total taxable value of land and additions on the property. | Land | Improvement |
|---|---|---|---|---|
| 2025 | $9,747 | $862,785 | $666,924 | $195,861 |
| 2024 | $9,747 | $845,869 | $653,848 | $192,021 |
| 2023 | $9,566 | $829,284 | $641,028 | $188,256 |
| 2022 | $9,437 | $813,024 | $628,459 | $184,565 |
| 2021 | $9,267 | $797,084 | $616,137 | $180,947 |
| 2020 | $9,127 | $788,912 | $609,820 | $179,092 |
| 2019 | $8,997 | $773,444 | $597,863 | $175,581 |
| 2018 | $8,718 | $758,280 | $586,141 | $172,139 |
| 2016 | $8,332 | $728,837 | $563,382 | $165,455 |
| 2015 | $8,150 | $717,890 | $554,920 | $162,970 |
| 2014 | $7,935 | $703,828 | $544,050 | $159,778 |
Source: Public Records
Map
Nearby Homes
- 4926 Jacques St
- 5033 Carmen St
- 5117 Cathann St
- 1108 Camino Real Unit 407
- 1108 Camino Real Unit 406
- 1108 Camino Real Unit 306
- 1108 Camino Real Unit 409
- 1110 Barbara St
- 1100 Barbara St
- 21110 Wood Ave
- 4402 Cathann St
- 21221 Grant Ave
- 22519 Evalyn Ave
- 603 S Prospect Ave Unit 205
- 601 S Prospect Ave Unit 103
- 22508 Shadycroft Ave
- 904 Knob Hill Ave
- 1200 Opal St Unit 7
- 4922 Reynolds Rd
- 802 Camino Real Unit 206
- 5034 W Carson St
- 5105 Jacques St
- 5111 Jacques St
- 5101 Jacques St
- 5030 W Carson St
- 5037 Jacques St
- 21733 Dewey Ave
- 5204 W Carson St
- 21737 Dewey Ave
- 5033 Jacques St
- 5105 W Carson St
- 5026 W Carson St
- 5111 W Carson St
- 5101 W Carson St
- 5115 W Carson St
- 21801 Dewey Ave
- 5033 W Carson St
- 5029 Jacques St
- 5203 W Carson St
- 5024 W Carson St
Your Personal Tour Guide
Ask me questions while you tour the home.