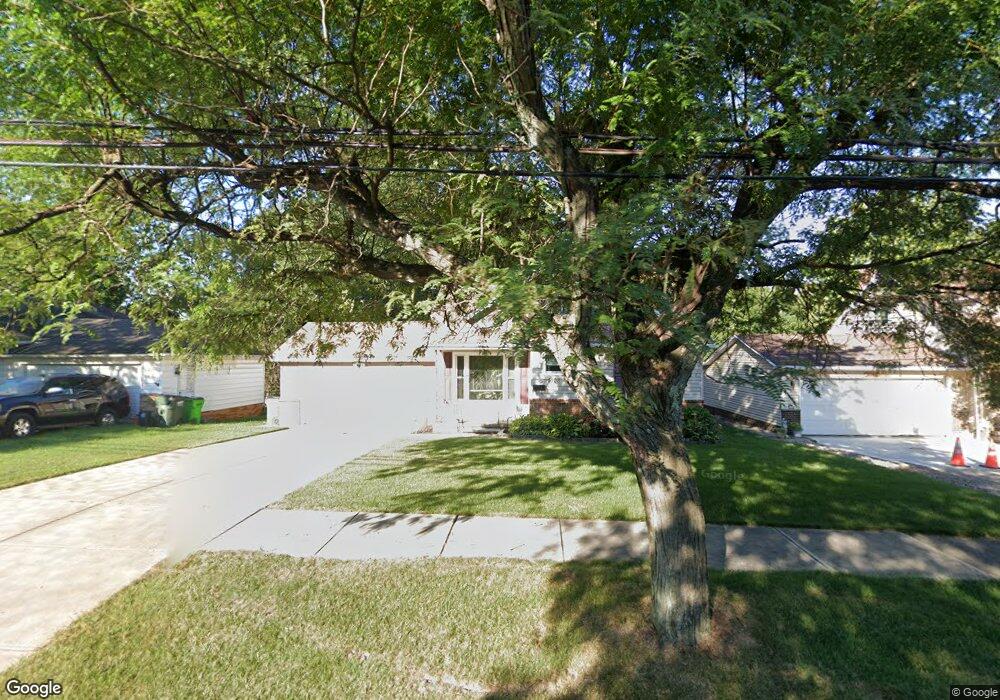
5108 Donovan Dr Cleveland, OH 44125
Estimated Value: $127,000 - $152,000
2
Beds
1
Bath
1,236
Sq Ft
$113/Sq Ft
Est. Value
About This Home
This home is located at 5108 Donovan Dr, Cleveland, OH 44125 and is currently estimated at $139,322, approximately $112 per square foot. 5108 Donovan Dr is a home located in Cuyahoga County with nearby schools including Garfield Heights High School, North Shore High School, and Holy Name Elementary School.
Ownership History
Date
Name
Owned For
Owner Type
Purchase Details
Closed on
Jan 4, 2011
Sold by
Community Reinvestment Llc
Bought by
Lee Kwartens Eldora E
Current Estimated Value
Home Financials for this Owner
Home Financials are based on the most recent Mortgage that was taken out on this home.
Original Mortgage
$123,239
Outstanding Balance
$83,900
Interest Rate
4.75%
Mortgage Type
FHA
Estimated Equity
$55,422
Purchase Details
Closed on
Aug 16, 2010
Sold by
Winans William I
Bought by
Community Reinvestment Llc
Purchase Details
Closed on
Sep 19, 2001
Sold by
Winans Diane D and Kuzma Thomas G
Bought by
Winans William I and The Kuzma Family Trust
Purchase Details
Closed on
Aug 10, 2001
Sold by
Kuzma Dorothy
Bought by
Winans Diane D and Kuzma Thomas G
Purchase Details
Closed on
Jan 25, 1977
Sold by
Kuzma Geo N and D A
Bought by
Kuzma Dorothy Stros
Purchase Details
Closed on
Jan 1, 1975
Bought by
Kuzma Geo N and D A
Create a Home Valuation Report for This Property
The Home Valuation Report is an in-depth analysis detailing your home's value as well as a comparison with similar homes in the area
Home Values in the Area
Average Home Value in this Area
Purchase History
| Date | Buyer | Sale Price | Title Company |
|---|---|---|---|
| Lee Kwartens Eldora E | $124,900 | Attorney | |
| Community Reinvestment Llc | $20,000 | Barristers Title Agency | |
| Winans William I | -- | -- | |
| Winans Diane D | -- | -- | |
| Kuzma Dorothy Stros | -- | -- | |
| Kuzma Geo N | -- | -- |
Source: Public Records
Mortgage History
| Date | Status | Borrower | Loan Amount |
|---|---|---|---|
| Open | Lee Kwartens Eldora E | $123,239 |
Source: Public Records
Tax History Compared to Growth
Tax History
| Year | Tax Paid | Tax Assessment Tax Assessment Total Assessment is a certain percentage of the fair market value that is determined by local assessors to be the total taxable value of land and additions on the property. | Land | Improvement |
|---|---|---|---|---|
| 2024 | $4,697 | $45,850 | $10,325 | $35,525 |
| 2023 | $3,485 | $31,120 | $8,470 | $22,650 |
| 2022 | $3,429 | $31,120 | $8,470 | $22,650 |
| 2021 | $3,623 | $31,120 | $8,470 | $22,650 |
| 2020 | $3,444 | $27,790 | $7,560 | $20,230 |
| 2019 | $3,413 | $79,400 | $21,600 | $57,800 |
| 2018 | $3,311 | $27,790 | $7,560 | $20,230 |
| 2017 | $3,227 | $24,540 | $5,430 | $19,110 |
| 2016 | $3,274 | $24,540 | $5,430 | $19,110 |
| 2015 | $3,604 | $24,540 | $5,430 | $19,110 |
| 2014 | $3,604 | $29,930 | $6,620 | $23,310 |
Source: Public Records
Map
Nearby Homes
- 8531 Cherie Dr
- 5074 Donovan Dr
- 8827 Park Heights Ave
- 9011 Park Heights Ave
- 4928 E 84th St
- 9302 Park Heights Ave
- 4963 E 88th St
- 4977 E 90th St
- 4909 E 85th St
- 4888 E 85th St
- 4915 E 88th St
- 4932 E 93rd St
- 4840 E 84th St
- 9612 Park Heights Ave
- 4830 E 88th St
- 4821 E 85th St
- 4903 E 94th St
- 4864 E 94th St
- 4815 E 86th St
- 9513 David Rd
- 5104 Donovan Dr
- 5112 Donovan Dr
- 5100 Donovan Dr
- 5116 Donovan Dr
- 5096 Donovan Dr
- 5120 Donovan Dr
- 5109 Donovan Dr
- 5117 Donovan Dr
- 8398 Doll Dr
- 5094 Donovan Dr
- 5124 Donovan Dr
- 5121 Donovan Dr
- 8422 Doll Dr
- 5090 Donovan Dr
- 8446 Doll Dr
- 8449 Cherie Dr
- 5086 Donovan Dr
- 8371 Doll Dr
- 8397 Doll Dr
- 8450 Doll Dr