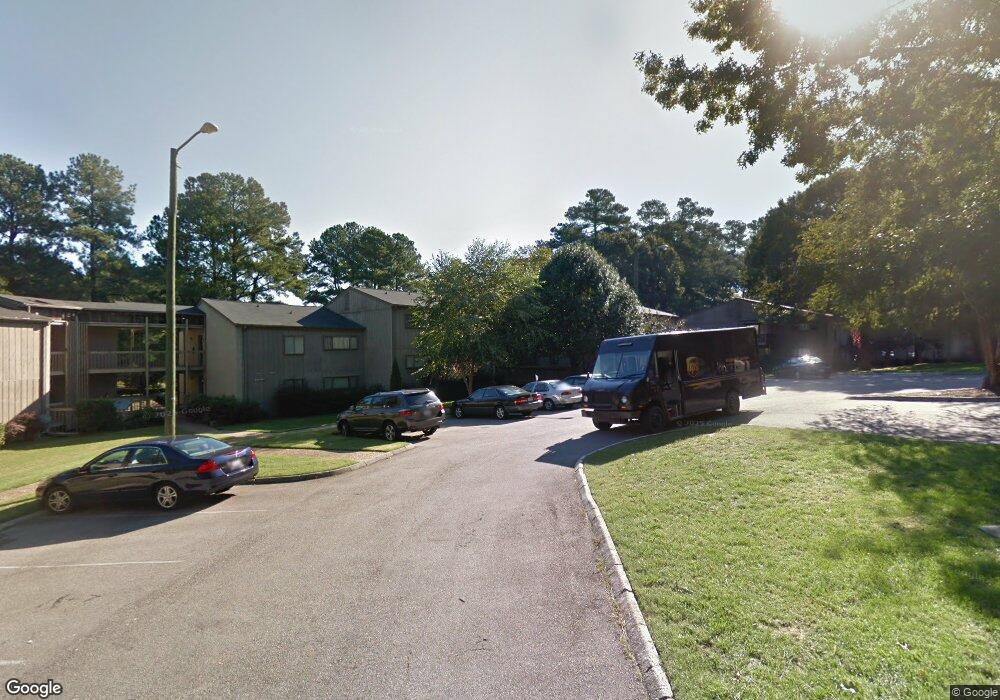
5108 Flint Ridge Place Unit 5108 Raleigh, NC 27609
North Hills NeighborhoodEstimated Value: $156,000 - $194,895
3
Beds
2
Baths
1,232
Sq Ft
$146/Sq Ft
Est. Value
About This Home
This home is located at 5108 Flint Ridge Place Unit 5108, Raleigh, NC 27609 and is currently estimated at $179,474, approximately $145 per square foot. 5108 Flint Ridge Place Unit 5108 is a home located in Wake County with nearby schools including Douglas Elementary, Carroll Middle, and Sanderson High School.
Ownership History
Date
Name
Owned For
Owner Type
Purchase Details
Closed on
May 23, 2019
Sold by
Christie Renee
Bought by
Ramaroson Sofolo
Current Estimated Value
Purchase Details
Closed on
Apr 23, 2019
Sold by
Christie Gregory and Christie Greg
Bought by
Christie Renee
Purchase Details
Closed on
Mar 23, 2016
Sold by
Boliek David L and Boliek Melissa Rouchell
Bought by
Christie Renee
Purchase Details
Closed on
Mar 5, 2012
Sold by
Boliek David L
Bought by
Boliek David L
Purchase Details
Closed on
Nov 29, 1999
Sold by
Monroe Robert E and Davis Lula
Bought by
Boliek David L
Home Financials for this Owner
Home Financials are based on the most recent Mortgage that was taken out on this home.
Original Mortgage
$53,750
Interest Rate
7.94%
Create a Home Valuation Report for This Property
The Home Valuation Report is an in-depth analysis detailing your home's value as well as a comparison with similar homes in the area
Home Values in the Area
Average Home Value in this Area
Purchase History
| Date | Buyer | Sale Price | Title Company |
|---|---|---|---|
| Ramaroson Sofolo | $90,000 | None Available | |
| Ramaroson Sofolo | $90,000 | None Listed On Document | |
| Christie Renee | -- | None Available | |
| Christie Renee | -- | None Listed On Document | |
| Christie Renee | $73,000 | None Available | |
| Boliek David L | -- | None Available | |
| Boliek David L | $67,500 | -- |
Source: Public Records
Mortgage History
| Date | Status | Borrower | Loan Amount |
|---|---|---|---|
| Previous Owner | Boliek David L | $53,750 |
Source: Public Records
Tax History Compared to Growth
Tax History
| Year | Tax Paid | Tax Assessment Tax Assessment Total Assessment is a certain percentage of the fair market value that is determined by local assessors to be the total taxable value of land and additions on the property. | Land | Improvement |
|---|---|---|---|---|
| 2025 | $1,750 | $198,400 | -- | $198,400 |
| 2024 | $1,743 | $198,400 | $0 | $198,400 |
| 2023 | $816 | $91,707 | $0 | $91,707 |
| 2022 | $760 | $91,707 | $0 | $91,707 |
| 2021 | $912 | $91,707 | $0 | $91,707 |
| 2020 | $718 | $91,707 | $0 | $91,707 |
| 2019 | $748 | $69,886 | $0 | $69,886 |
| 2018 | $706 | $69,886 | $0 | $69,886 |
| 2017 | $673 | $69,886 | $0 | $69,886 |
| 2016 | $0 | $69,886 | $0 | $69,886 |
| 2015 | -- | $73,907 | $0 | $73,907 |
| 2014 | $746 | $73,907 | $0 | $73,907 |
Source: Public Records
Map
Nearby Homes
- 5026 Flint Ridge Place
- 642 Pine Ridge Place Unit 642
- 5073 Tall Pines Ct Unit 5073
- 5082 Flint Ridge Place Unit 5082
- 717 E Millbrook Rd Unit 717
- 635 Pine Ridge Place
- 612 Pine Ridge Place
- 677 Pine Ridge Place
- 627 Pine Ridge Place
- 5036 Flint Ridge Place Unit 5036
- 514 Pine Ridge Place
- 667 Pine Ridge Place
- 5080 Flint Ridge Place Unit 5080
- 5104 Cedarwood Dr
- 508 Driewood Ct
- 5309 Alpine Dr
- 601 Duke Dr
- 4901 Baylor Ct
- 4921 Sweetbriar Dr
- 4900 Great Meadows Ct
- 631 Pine Ridge Place
- 5011 Tall Pines Ct Unit 5011
- 5045 Tall Pines Ct Unit 5045
- 5100 Flint Ridge Place
- 5033 Tall Pines Ct Unit 5033
- 5065 Tall Pines Ct Unit 5065
- 5043 Tall Pines Ct Unit 5043
- 5126 Flint Ridge Place Unit 5126
- 5124 Flint Ridge Place
- 524 Pine Ridge Place Unit 524
- 5008 Flint Ridge Place Unit 5008
- 5064 Flint Ridge Place Unit 5064
- 5014 Flint Ridge Place Unit 5014
- 5016 Flint Ridge Place Unit 5016
- 5018 Flint Ridge Place Unit 5018
- 628 Pine Ridge Place
- 614 Pine Ridge Place Unit 614
- 638 Pine Ridge Place Unit 638
- 610 Pine Ridge Place
- 606 Pine Ridge Place Unit 606