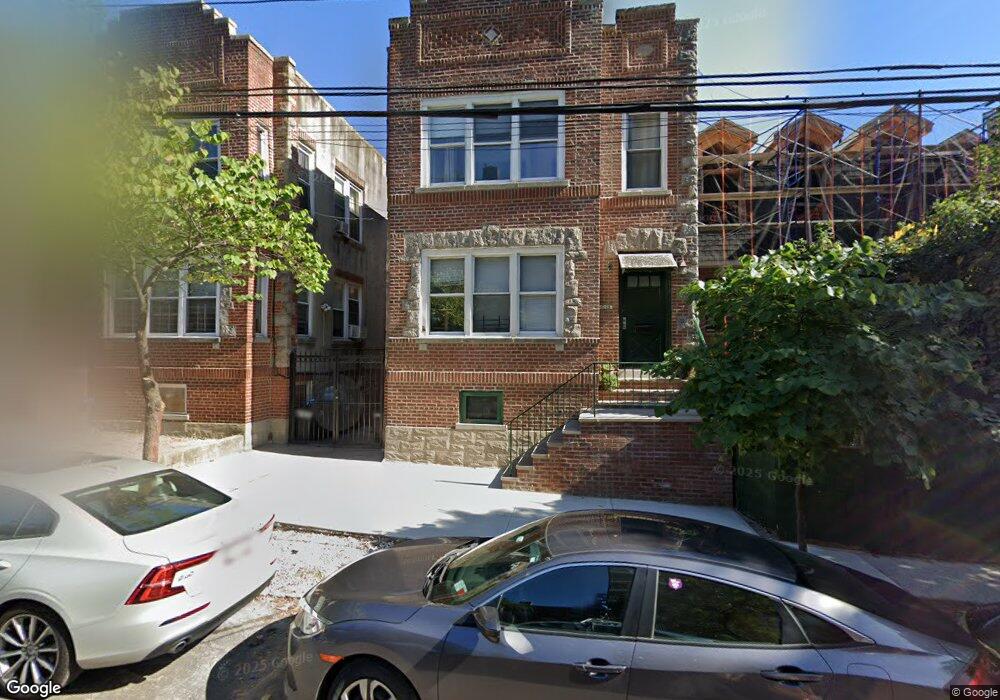
5108 Post Rd Unit 2 Bronx, NY 10471
Fieldston NeighborhoodEstimated Value: $1,153,000 - $1,300,170
3
Beds
1
Bath
3,511
Sq Ft
$343/Sq Ft
Est. Value
About This Home
This home is located at 5108 Post Rd Unit 2, Bronx, NY 10471 and is currently estimated at $1,204,543, approximately $343 per square foot. 5108 Post Rd Unit 2 is a home located in Bronx County with nearby schools including P.S. 81 - Robert J. Christen, Riverdale Kingsbridge Academy, and Horace Mann School Lower Division.
Ownership History
Date
Name
Owned For
Owner Type
Purchase Details
Closed on
Nov 17, 2014
Sold by
Cockerille James Thomas and Gratz Cockerille Anna Esther
Bought by
Capdepon Xavier P J and Gomez Dannyvia
Current Estimated Value
Home Financials for this Owner
Home Financials are based on the most recent Mortgage that was taken out on this home.
Original Mortgage
$640,000
Outstanding Balance
$488,993
Interest Rate
3.93%
Mortgage Type
Purchase Money Mortgage
Estimated Equity
$715,550
Purchase Details
Closed on
Jul 27, 2012
Sold by
Estate Of Elizabeth Lane
Bought by
Cockerille Anna Esther G and Cockerille James Thomas
Home Financials for this Owner
Home Financials are based on the most recent Mortgage that was taken out on this home.
Original Mortgage
$476,000
Interest Rate
3.7%
Mortgage Type
New Conventional
Create a Home Valuation Report for This Property
The Home Valuation Report is an in-depth analysis detailing your home's value as well as a comparison with similar homes in the area
Home Values in the Area
Average Home Value in this Area
Purchase History
| Date | Buyer | Sale Price | Title Company |
|---|---|---|---|
| Capdepon Xavier P J | $800,000 | -- | |
| Cockerille Anna Esther G | $595,000 | -- |
Source: Public Records
Mortgage History
| Date | Status | Borrower | Loan Amount |
|---|---|---|---|
| Open | Capdepon Xavier P J | $640,000 | |
| Previous Owner | Cockerille Anna Esther G | $476,000 |
Source: Public Records
Tax History
| Year | Tax Paid | Tax Assessment Tax Assessment Total Assessment is a certain percentage of the fair market value that is determined by local assessors to be the total taxable value of land and additions on the property. | Land | Improvement |
|---|---|---|---|---|
| 2025 | $10,171 | $53,677 | $9,653 | $44,024 |
| 2024 | $10,171 | $50,640 | $8,255 | $42,385 |
| 2023 | $9,702 | $47,774 | $8,206 | $39,568 |
| 2022 | $9,537 | $69,660 | $13,800 | $55,860 |
| 2021 | $9,978 | $71,520 | $13,800 | $57,720 |
| 2020 | $9,468 | $68,220 | $13,800 | $54,420 |
| 2019 | $8,828 | $54,960 | $13,800 | $41,160 |
| 2018 | $7,818 | $39,812 | $11,561 | $28,251 |
| 2017 | $7,816 | $39,812 | $12,341 | $27,471 |
| 2016 | $7,589 | $39,512 | $13,190 | $26,322 |
| 2015 | $4,310 | $37,276 | $14,749 | $22,527 |
| 2014 | $4,310 | $35,167 | $12,435 | $22,732 |
Source: Public Records
Map
Nearby Homes
- 255 Fieldston Terrace Unit 2L
- 5030 Tibbett Ave
- 5235 Post Rd Unit 2C
- 5235 Post Rd Unit 3H
- 5235 Post Rd Unit 5A
- 6291 Broadway Unit A6
- 4621 Waldo Ave
- 4445 Post Rd Unit 3B
- 4930 Goodridge Ave
- 5041 Goodridge Ave Unit 1
- 5030 Grosvenor Ave
- 5020 Grosvenor Ave
- 5020 Grosvenor Ave Unit 1
- 4410 Cayuga Ave Unit 1D
- 5000 Grosvenor Ave
- 4525 Greystone Ave
- 5021 Grosvenor Ave
- 5000 Iselin Ave
- 5310 Grosvenor Ave
- 5020 Iselin Ave
- 5108 Post Rd
- 5110 Post Rd Unit 2
- 5110 Post Rd Unit 1
- 5110 Post Rd
- 5112 Post Rd
- 5112 Post Rd Unit DUPLEX
- 5112 Post Rd Unit 2
- 5112 Post Rd Unit 5112 Pos
- 5104 Post Rd Unit 3F
- 5104 Post Rd
- 5102 Post Rd Unit 5104A
- 5102-5104A Post Rd
- 5114 Post Rd
- 221 W 251st St
- 268 W 251st St
- 260 W 251st St
- 5117 Post Rd
- 6211 Broadway Unit 3D
- 6211 Broadway
- 6211 Broadway Unit 4E
Your Personal Tour Guide
Ask me questions while you tour the home.