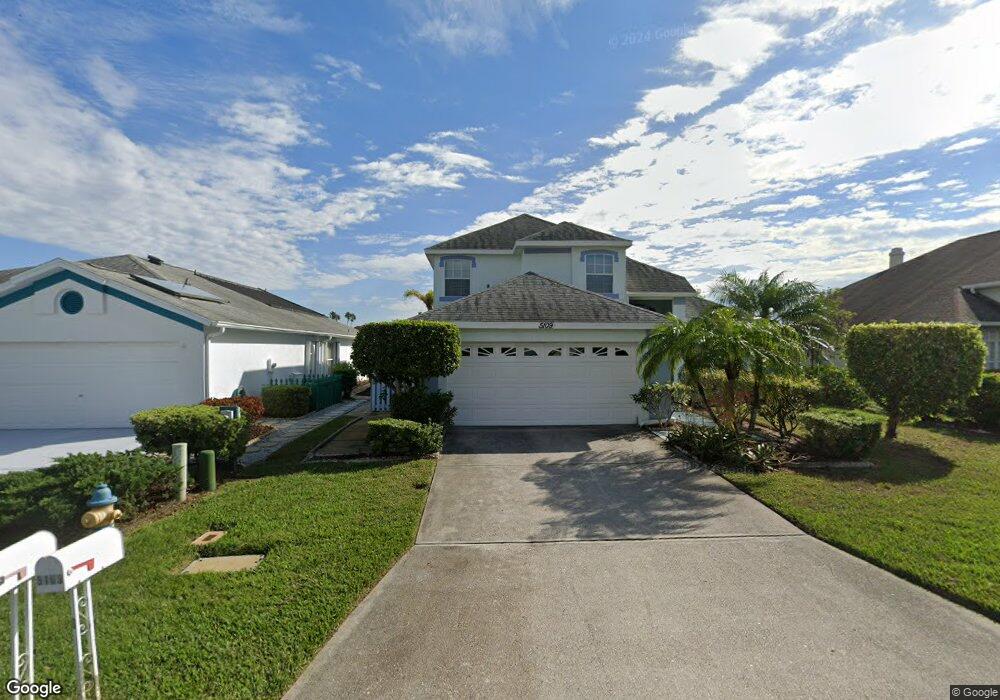
5109 40th St W Bradenton, FL 34210
South Bradenton NeighborhoodEstimated Value: $470,757 - $515,000
4
Beds
3
Baths
1,915
Sq Ft
$254/Sq Ft
Est. Value
About This Home
This home is located at 5109 40th St W, Bradenton, FL 34210 and is currently estimated at $487,189, approximately $254 per square foot. 5109 40th St W is a home located in Manatee County with nearby schools including H. S. Moody Elementary School, Electa Lee Magnet Middle School, and Bayshore High School.
Ownership History
Date
Name
Owned For
Owner Type
Purchase Details
Closed on
Apr 8, 2015
Sold by
Ferreira Melanie C
Bought by
Yuan Weidong
Current Estimated Value
Purchase Details
Closed on
Nov 22, 2005
Sold by
Ferreira Jan F and Ferreira Melanie C
Bought by
Ferreira Melanie C
Home Financials for this Owner
Home Financials are based on the most recent Mortgage that was taken out on this home.
Original Mortgage
$258,000
Interest Rate
6.1%
Mortgage Type
New Conventional
Purchase Details
Closed on
Jan 24, 1997
Sold by
Kish Edward E and Kish Jean L
Bought by
Ferreira Melanie C and Ferreira Jan F
Home Financials for this Owner
Home Financials are based on the most recent Mortgage that was taken out on this home.
Original Mortgage
$126,000
Interest Rate
7.77%
Purchase Details
Closed on
Dec 15, 1994
Sold by
Centex Real Est Corp
Bought by
Kish Edward E and Kish Jean L
Home Financials for this Owner
Home Financials are based on the most recent Mortgage that was taken out on this home.
Original Mortgage
$55,900
Interest Rate
9.07%
Create a Home Valuation Report for This Property
The Home Valuation Report is an in-depth analysis detailing your home's value as well as a comparison with similar homes in the area
Home Values in the Area
Average Home Value in this Area
Purchase History
| Date | Buyer | Sale Price | Title Company |
|---|---|---|---|
| Yuan Weidong | $263,200 | Barnes Walker Title Inc | |
| Ferreira Melanie C | -- | Bayshore Title Insurance Co | |
| Ferreira Melanie C | $141,500 | -- | |
| Kish Edward E | $120,100 | -- |
Source: Public Records
Mortgage History
| Date | Status | Borrower | Loan Amount |
|---|---|---|---|
| Previous Owner | Ferreira Melanie C | $258,000 | |
| Previous Owner | Ferreira Melanie C | $126,000 | |
| Previous Owner | Kish Edward E | $55,900 |
Source: Public Records
Tax History
| Year | Tax Paid | Tax Assessment Tax Assessment Total Assessment is a certain percentage of the fair market value that is determined by local assessors to be the total taxable value of land and additions on the property. | Land | Improvement |
|---|---|---|---|---|
| 2025 | $5,954 | $397,826 | -- | -- |
| 2023 | $5,782 | $421,472 | $53,550 | $367,922 |
| 2022 | $5,220 | $369,564 | $52,500 | $317,064 |
| 2021 | $4,298 | $271,721 | $37,500 | $234,221 |
| 2020 | $4,400 | $265,492 | $40,000 | $225,492 |
| 2019 | $4,341 | $259,524 | $40,000 | $219,524 |
| 2018 | $4,109 | $248,127 | $40,000 | $208,127 |
| 2017 | $3,550 | $221,195 | $0 | $0 |
| 2016 | $3,273 | $196,556 | $0 | $0 |
| 2015 | $2,281 | $170,562 | $0 | $0 |
| 2014 | $2,281 | $169,208 | $0 | $0 |
| 2013 | -- | $166,707 | $27,550 | $139,157 |
Source: Public Records
Map
Nearby Homes
- 5142 41st St W
- 5132 36th St W
- 3920 52nd Dr W
- 597 Lakeside Dr
- 635 Woodlawn Dr Unit 635
- 182 Pineneedle Dr Unit 182
- 645 Woodlawn Dr Unit 645
- 647 Woodlawn Dr Unit 647
- 533 Lakeside Dr Unit 533
- 509 Lakeside Dr Unit 509
- 542 Dr Unit 542
- 162 Pineneedle Dr
- 511 Lakeside Dr Unit 511
- 521 Lakeside Dr Unit 521
- 545 Lakeside Dr
- 3451 51st Avenue Cir W Unit 218
- 703 Oakview Dr Unit 703D
- 220 Pineneedle Dr Unit 220
- 3470 51st Avenue Dr W Unit 243
- 3468 51st Avenue Dr W
- 5113 40th St W
- 5105 40th St W
- 5117 40th St W
- 5101 40th St W
- 5106 40th St W
- 5104 40th St W
- 5110 40th St W
- 5121 40th St W
- 4001 51st Place W
- 5114 40th St W
- 5118 40th St W
- 4005 51st Place W
- 5131 41st St W
- 5127 41st St W
- 5124 40th St W
- 5135 41st St W
- 4009 51st Place W
- 3912 51st Dr W
- 3916 51st Dr W
- 3908 51st Dr W
Your Personal Tour Guide
Ask me questions while you tour the home.