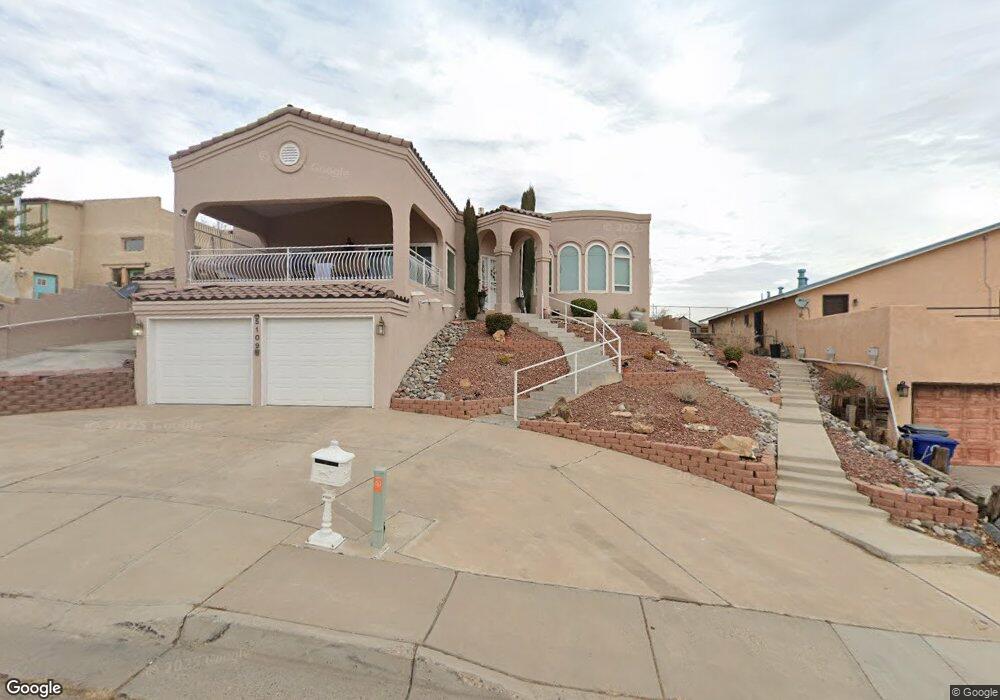
5109 Cascade Place NW Albuquerque, NM 87105
West Mesa NeighborhoodEstimated Value: $341,000 - $415,000
4
Beds
2
Baths
2,039
Sq Ft
$183/Sq Ft
Est. Value
About This Home
This home is located at 5109 Cascade Place NW, Albuquerque, NM 87105 and is currently estimated at $372,479, approximately $182 per square foot. 5109 Cascade Place NW is a home located in Bernalillo County with nearby schools including Lavaland Elementary School, John Adams Middle School, and West Mesa High School.
Ownership History
Date
Name
Owned For
Owner Type
Purchase Details
Closed on
Oct 3, 2014
Sold by
Depper Ronald S
Bought by
Depper Ronald S
Current Estimated Value
Purchase Details
Closed on
Feb 24, 2004
Sold by
Torres Margo and Torres Marcella T
Bought by
Torres Margo and Torres Marcella T
Purchase Details
Closed on
Sep 16, 2002
Sold by
Rabadi Sharif A and Rabadi Samia S
Bought by
Fidelity National Title Insurance Co
Purchase Details
Closed on
Sep 11, 2000
Sold by
Torres Margo and Torres Marcella T
Bought by
Torres Margo and Torres Marcella T
Home Financials for this Owner
Home Financials are based on the most recent Mortgage that was taken out on this home.
Original Mortgage
$149,000
Interest Rate
8.15%
Purchase Details
Closed on
Jul 31, 2000
Sold by
Torres Margo and Torres Marcella T
Bought by
Torres Margo and Torres Marcella T
Home Financials for this Owner
Home Financials are based on the most recent Mortgage that was taken out on this home.
Original Mortgage
$149,000
Interest Rate
8.15%
Create a Home Valuation Report for This Property
The Home Valuation Report is an in-depth analysis detailing your home's value as well as a comparison with similar homes in the area
Home Values in the Area
Average Home Value in this Area
Purchase History
| Date | Buyer | Sale Price | Title Company |
|---|---|---|---|
| Depper Ronald S | -- | Stewart Title | |
| Torres Margo | -- | -- | |
| Fidelity National Title Insurance Co | -- | Fidelity National Title Ins | |
| Torres Margo | -- | -- | |
| Torres Margo | -- | Fidelity National Title Ins |
Source: Public Records
Mortgage History
| Date | Status | Borrower | Loan Amount |
|---|---|---|---|
| Previous Owner | Torres Margo | $149,000 |
Source: Public Records
Tax History Compared to Growth
Tax History
| Year | Tax Paid | Tax Assessment Tax Assessment Total Assessment is a certain percentage of the fair market value that is determined by local assessors to be the total taxable value of land and additions on the property. | Land | Improvement |
|---|---|---|---|---|
| 2024 | $3,265 | $76,113 | $24,308 | $51,805 |
| 2023 | $3,072 | $73,897 | $23,600 | $50,297 |
| 2022 | $2,966 | $71,745 | $22,913 | $48,832 |
| 2021 | $2,864 | $69,656 | $22,246 | $47,410 |
| 2020 | $2,815 | $67,627 | $21,598 | $46,029 |
| 2019 | $2,814 | $67,627 | $21,598 | $46,029 |
| 2018 | $2,718 | $67,627 | $21,598 | $46,029 |
| 2017 | $2,632 | $65,811 | $13,605 | $52,206 |
| 2016 | $2,554 | $62,034 | $12,824 | $49,210 |
| 2015 | $60,228 | $60,228 | $12,451 | $47,777 |
| 2014 | $2,398 | $58,473 | $12,088 | $46,385 |
| 2013 | -- | $56,770 | $11,736 | $45,034 |
Source: Public Records
Map
Nearby Homes
- 1752 Cliffside Dr NW
- 1756 Cliffside Dr NW
- 1663 Corte Del Sol NW
- 1802 Calle Del Vista
- 1604 Bluffside Place NW
- 0 Rd NW Unit 1081568
- 0 Rd NW Unit 1081569
- 3837 Riverview Rd NW
- 5009 Ian Ave NW
- 1435 Loma Hermosa Dr NW
- 5609 Del Oeste Rd NW
- 1402 Crescent Dr NW
- 1407 Crescent Dr NW
- 1509 56th St NW
- 5709 El Rito Ave NW
- 5142 Western Breeze Ct NW
- 2700 Vista Grande Dr NW Unit 56
- 3305 Maxum Ln NW
- 2505 Maiden Grass Rd NW
- 0 Place NW Unit 1076402
- 5115 Cascade Place NW
- 5105 Cascade Place NW
- 5117 Cascade Place NW
- 5101 Cascade Place NW
- 5125 Cascade Place NW
- 1817 Bluffside Dr NW
- 5129 Cascade Place NW
- 5021 Cascade Place NW
- 1761 Cliffside Dr NW
- 1749 Cliffside Dr NW
- 1753 Cliffside Dr NW
- 1757 Cliffside Dr NW
- 1740 Cliffside Dr NW
- 1745 Cliffside Dr NW
- 1736 Cliffside Dr NW
- 1809 Bluffside Dr NW
- 1739 Avenida Real NW
- 1737 Cliffside Dr NW
- 1732 Cliffside Dr NW
- 5016 Cascade Place NW