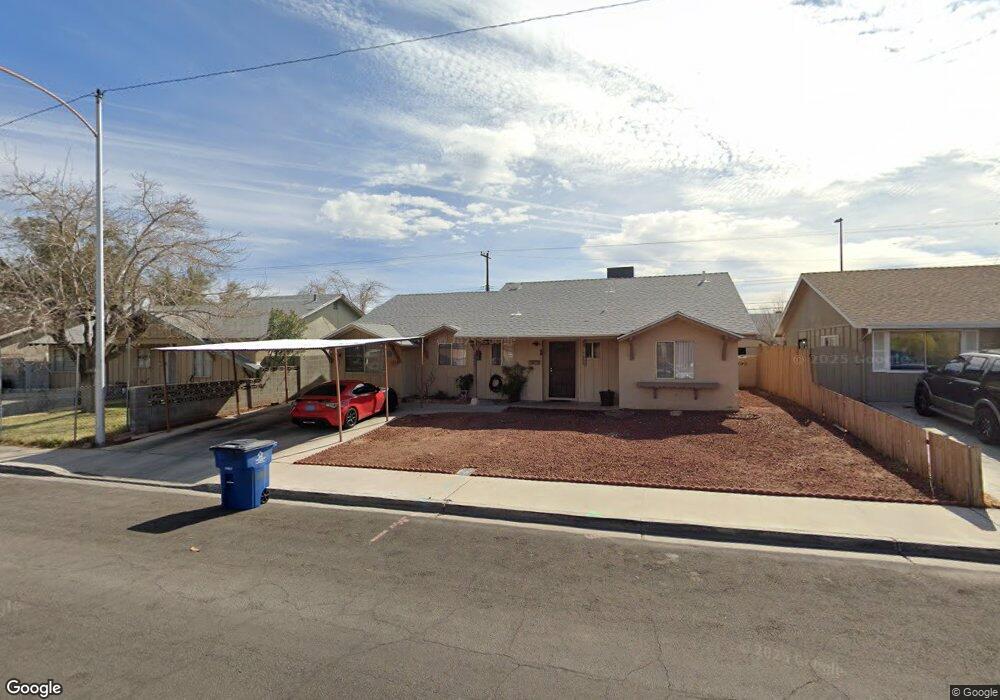
5109 Churchill Ave Las Vegas, NV 89107
Buffalo NeighborhoodEstimated Value: $345,000 - $390,000
3
Beds
2
Baths
1,628
Sq Ft
$228/Sq Ft
Est. Value
About This Home
This home is located at 5109 Churchill Ave, Las Vegas, NV 89107 and is currently estimated at $371,427, approximately $228 per square foot. 5109 Churchill Ave is a home located in Clark County with nearby schools including Red Rock Elementary School, Frank F Garside Junior High School, and Western High School.
Ownership History
Date
Name
Owned For
Owner Type
Purchase Details
Closed on
Sep 18, 2009
Sold by
Wells Fargo Bank National Association
Bought by
Hanson Dennis R and Hanson Claudine L
Current Estimated Value
Purchase Details
Closed on
May 13, 2009
Sold by
Shepler Barbara J
Bought by
Wells Fargo Bank National Association
Purchase Details
Closed on
Nov 22, 2002
Sold by
Shepler Barbara
Bought by
Shepler Barbara J
Home Financials for this Owner
Home Financials are based on the most recent Mortgage that was taken out on this home.
Original Mortgage
$81,920
Interest Rate
6.12%
Purchase Details
Closed on
Feb 15, 2000
Sold by
Shepler Edward
Bought by
Shepler Edward and Shepler Barbara
Purchase Details
Closed on
Feb 27, 1997
Sold by
Ribicki Raymond J and Ribicki Shirley
Bought by
Shepler Edward I and Shepler Billie S
Home Financials for this Owner
Home Financials are based on the most recent Mortgage that was taken out on this home.
Original Mortgage
$73,440
Interest Rate
7.86%
Mortgage Type
VA
Create a Home Valuation Report for This Property
The Home Valuation Report is an in-depth analysis detailing your home's value as well as a comparison with similar homes in the area
Home Values in the Area
Average Home Value in this Area
Purchase History
| Date | Buyer | Sale Price | Title Company |
|---|---|---|---|
| Hanson Dennis R | $48,000 | Chicago Title Las Vegas | |
| Wells Fargo Bank National Association | $148,923 | Fidelity National Default So | |
| Shepler Barbara J | -- | Lawyers Title | |
| Shepler Edward | -- | -- | |
| Shepler Edward I | $72,000 | Fidelity National Title |
Source: Public Records
Mortgage History
| Date | Status | Borrower | Loan Amount |
|---|---|---|---|
| Previous Owner | Shepler Barbara J | $81,920 | |
| Previous Owner | Shepler Edward I | $73,440 |
Source: Public Records
Tax History Compared to Growth
Tax History
| Year | Tax Paid | Tax Assessment Tax Assessment Total Assessment is a certain percentage of the fair market value that is determined by local assessors to be the total taxable value of land and additions on the property. | Land | Improvement |
|---|---|---|---|---|
| 2025 | $810 | $56,792 | $35,700 | $21,092 |
| 2024 | $750 | $56,792 | $35,700 | $21,092 |
| 2023 | $750 | $52,397 | $33,250 | $19,147 |
| 2022 | $695 | $45,424 | $28,350 | $17,074 |
| 2021 | $644 | $41,091 | $25,200 | $15,891 |
| 2020 | $616 | $38,520 | $23,100 | $15,420 |
| 2019 | $588 | $36,246 | $21,350 | $14,896 |
| 2018 | $561 | $30,777 | $16,800 | $13,977 |
| 2017 | $982 | $29,947 | $16,100 | $13,847 |
| 2016 | $532 | $27,720 | $14,350 | $13,370 |
| 2015 | $531 | $21,721 | $8,750 | $12,971 |
| 2014 | $514 | $15,225 | $5,600 | $9,625 |
Source: Public Records
Map
Nearby Homes
- 4913 Churchill Ave
- 5220 Mission Carmel Ln Unit 103
- 5220 Mission Carmel Ln Unit 107
- 220 Mission Catalina Ln Unit 207
- 220 Mission Catalina Ln Unit 202
- 5261 Mission Carmel Ln Unit 204
- 230 Mission Catalina Ln Unit 202
- 230 Mission Newport Ln Unit 104
- 220 Mission Newport Ln Unit 105
- 220 Mission Newport Ln Unit 106
- 220 Mission Newport Ln Unit 201
- 104 Stanford St
- 231 Mission Newport Ln Unit 102
- 221 Mission Newport Ln Unit 205
- 201 Mission Laguna Ln Unit 104
- 211 Mission Laguna Ln Unit 205
- 116 Princeton St
- 332 Wild Plum Ln
- 344 Wild Plum Ln
- 5117 Arbor Way
- 5105 Churchill Ave
- 5113 Churchill Ave
- 5201 Churchill Ave
- 5108 Churchill Ave
- 5104 Churchill Ave
- 5112 Churchill Ave
- 5013 Churchill Ave
- 5205 Churchill Ave
- 5100 Churchill Ave
- 5012 Churchill Ave
- 5009 Churchill Ave
- 5209 Churchill Ave
- 5204 Churchill Ave
- 5109 Harmony Ave
- 5105 Harmony Ave
- 5008 Churchill Ave
- 5113 Harmony Ave
- 5101 Harmony Ave
- 5201 Harmony Ave