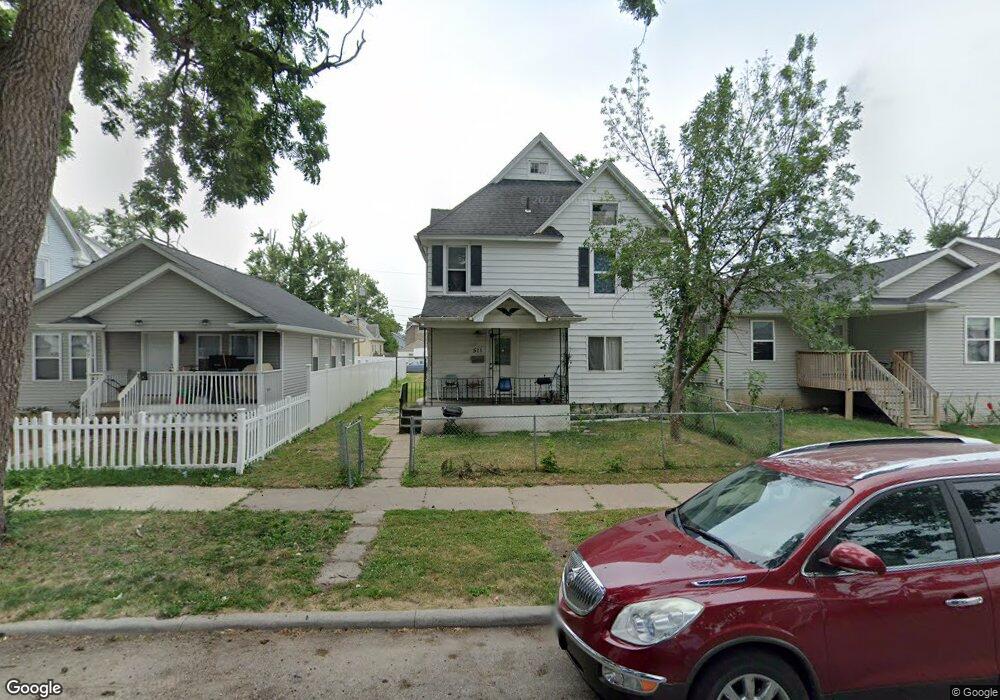
511 7th Ave SW Cedar Rapids, IA 52404
Taylor NeighborhoodEstimated Value: $127,508 - $174,000
4
Beds
2
Baths
1,560
Sq Ft
$98/Sq Ft
Est. Value
About This Home
This home is located at 511 7th Ave SW, Cedar Rapids, IA 52404 and is currently estimated at $152,877, approximately $97 per square foot. 511 7th Ave SW is a home located in Linn County with nearby schools including Cedar River Academy at Taylor Elementary School, Wilson Middle School, and Thomas Jefferson High School.
Ownership History
Date
Name
Owned For
Owner Type
Purchase Details
Closed on
Jul 3, 2009
Sold by
Pencook James E and Pencook Joyce N
Bought by
Brines Kenneth M
Current Estimated Value
Purchase Details
Closed on
Apr 8, 2009
Sold by
Brines Kenneth M
Bought by
7As Investments Llc
Home Financials for this Owner
Home Financials are based on the most recent Mortgage that was taken out on this home.
Original Mortgage
$23,000
Interest Rate
5.05%
Mortgage Type
Purchase Money Mortgage
Purchase Details
Closed on
Jul 17, 2008
Sold by
Henry Arletta
Bought by
Brines Kenneth M
Purchase Details
Closed on
Jun 30, 2007
Sold by
Brines Kenneth M
Bought by
Henry Arleta
Create a Home Valuation Report for This Property
The Home Valuation Report is an in-depth analysis detailing your home's value as well as a comparison with similar homes in the area
Home Values in the Area
Average Home Value in this Area
Purchase History
| Date | Buyer | Sale Price | Title Company |
|---|---|---|---|
| Brines Kenneth M | $13,500 | None Available | |
| 7As Investments Llc | $22,500 | None Available | |
| Brines Kenneth M | -- | None Available | |
| Henry Arleta | $60,000 | None Available |
Source: Public Records
Mortgage History
| Date | Status | Borrower | Loan Amount |
|---|---|---|---|
| Previous Owner | 7As Investments Llc | $23,000 | |
| Closed | Henry Arleta | $0 |
Source: Public Records
Tax History
| Year | Tax Paid | Tax Assessment Tax Assessment Total Assessment is a certain percentage of the fair market value that is determined by local assessors to be the total taxable value of land and additions on the property. | Land | Improvement |
|---|---|---|---|---|
| 2025 | $1,926 | $111,800 | $26,300 | $85,500 |
| 2024 | $2,102 | $108,800 | $24,200 | $84,600 |
| 2023 | $2,102 | $108,800 | $24,200 | $84,600 |
| 2022 | $1,868 | $99,700 | $20,200 | $79,500 |
| 2021 | $1,814 | $90,200 | $20,200 | $70,000 |
| 2020 | $1,814 | $82,200 | $18,200 | $64,000 |
| 2019 | $1,720 | $79,800 | $18,200 | $61,600 |
Source: Public Records
Map
Nearby Homes
Your Personal Tour Guide
Ask me questions while you tour the home.