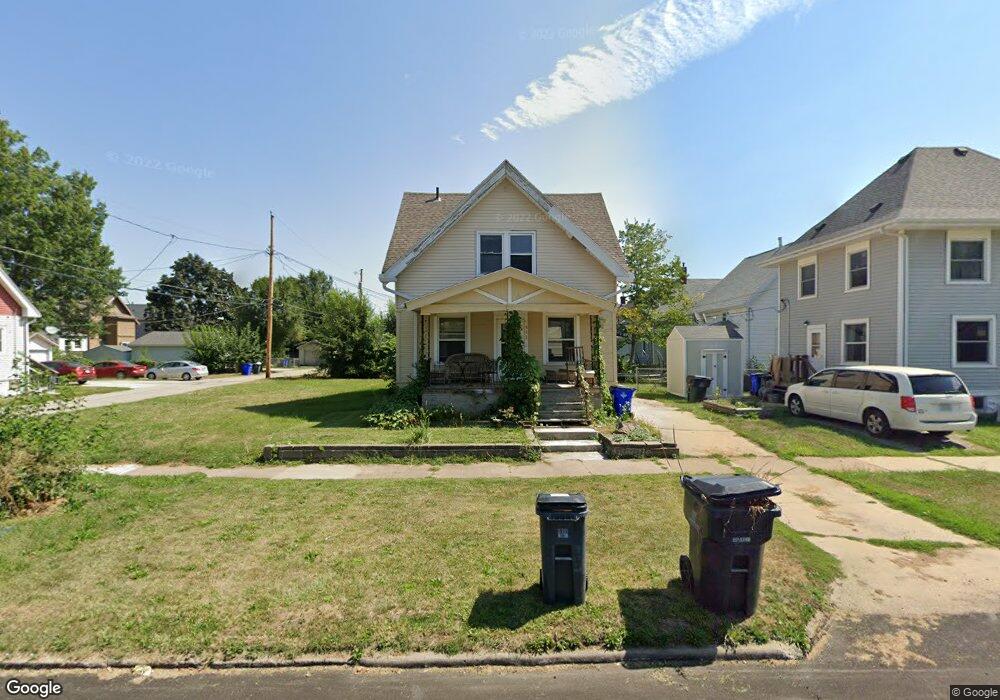
511 9th St NW Cedar Rapids, IA 52405
Northwest Area NeighborhoodEstimated Value: $120,000 - $134,000
2
Beds
1
Bath
1,103
Sq Ft
$112/Sq Ft
Est. Value
About This Home
This home is located at 511 9th St NW, Cedar Rapids, IA 52405 and is currently estimated at $123,627, approximately $112 per square foot. 511 9th St NW is a home located in Linn County with nearby schools including Junction City Elementary School, Harrison Elementary School, and Kentucky Tech - Ashland Reg Tech Center.
Ownership History
Date
Name
Owned For
Owner Type
Purchase Details
Closed on
Jul 18, 2017
Sold by
Wilcox Anna C
Bought by
Macdougall Marren W
Current Estimated Value
Home Financials for this Owner
Home Financials are based on the most recent Mortgage that was taken out on this home.
Original Mortgage
$72,250
Outstanding Balance
$60,612
Interest Rate
4.25%
Mortgage Type
Adjustable Rate Mortgage/ARM
Estimated Equity
$63,015
Purchase Details
Closed on
Sep 29, 2009
Sold by
Derlein Jeffrey A and Derlein Robin M
Bought by
Wilcox Anna C
Home Financials for this Owner
Home Financials are based on the most recent Mortgage that was taken out on this home.
Original Mortgage
$79,532
Interest Rate
5.19%
Mortgage Type
FHA
Purchase Details
Closed on
Apr 20, 2004
Sold by
Giza Anthony A and Giza Cora Ann
Bought by
Derlein Jeffrey A and Derlein Robin M
Home Financials for this Owner
Home Financials are based on the most recent Mortgage that was taken out on this home.
Original Mortgage
$48,600
Interest Rate
5.37%
Mortgage Type
Unknown
Create a Home Valuation Report for This Property
The Home Valuation Report is an in-depth analysis detailing your home's value as well as a comparison with similar homes in the area
Home Values in the Area
Average Home Value in this Area
Purchase History
| Date | Buyer | Sale Price | Title Company |
|---|---|---|---|
| Macdougall Marren W | $85,000 | None Available | |
| Wilcox Anna C | $80,500 | None Available | |
| Derlein Jeffrey A | $53,500 | -- |
Source: Public Records
Mortgage History
| Date | Status | Borrower | Loan Amount |
|---|---|---|---|
| Open | Macdougall Marren W | $72,250 | |
| Previous Owner | Wilcox Anna C | $79,532 | |
| Previous Owner | Derlein Jeffrey A | $48,600 |
Source: Public Records
Tax History Compared to Growth
Tax History
| Year | Tax Paid | Tax Assessment Tax Assessment Total Assessment is a certain percentage of the fair market value that is determined by local assessors to be the total taxable value of land and additions on the property. | Land | Improvement |
|---|---|---|---|---|
| 2025 | $1,790 | $113,300 | $18,000 | $95,300 |
| 2024 | $1,838 | $107,200 | $16,600 | $90,600 |
| 2023 | $1,838 | $101,200 | $14,600 | $86,600 |
| 2022 | $1,706 | $87,100 | $14,600 | $72,500 |
| 2021 | $1,746 | $82,400 | $14,600 | $67,800 |
| 2020 | $1,746 | $79,100 | $10,600 | $68,500 |
| 2019 | $1,596 | $74,000 | $9,300 | $64,700 |
| 2018 | $1,488 | $74,000 | $9,300 | $64,700 |
| 2017 | $1,164 | $62,000 | $9,300 | $52,700 |
| 2016 | $1,317 | $62,000 | $9,300 | $52,700 |
| 2015 | $1,433 | $67,326 | $9,310 | $58,016 |
| 2014 | $1,248 | $67,326 | $9,310 | $58,016 |
| 2013 | $1,216 | $67,326 | $9,310 | $58,016 |
Source: Public Records
Map
Nearby Homes
- 720 E Ave NW
- 714 East Ave NW
- 716 F Ave NW
- 217 11th St NW
- 819 G Ave NW
- 1020 A Ave NW
- 816 9th St NW
- 1073 G Ave NW
- 718 4th St NW
- 1016 H Ave NW
- 810 3rd Ave SW
- 1118 2nd Ave SW
- 1311 Burch Ave NW
- 1025 3rd Ave SW
- 531 10th St SW
- 263 Highland Dr NW
- 290 Highland Dr NW
- 531 9th St SW
- 235 Highland Dr NW
- 1015 Pawnee Dr NW