P
Seller's Agent in 2012
Penni Ivy
Coldwell Banker Walden & Kirkland
Estimated Value: $178,263 - $187,000
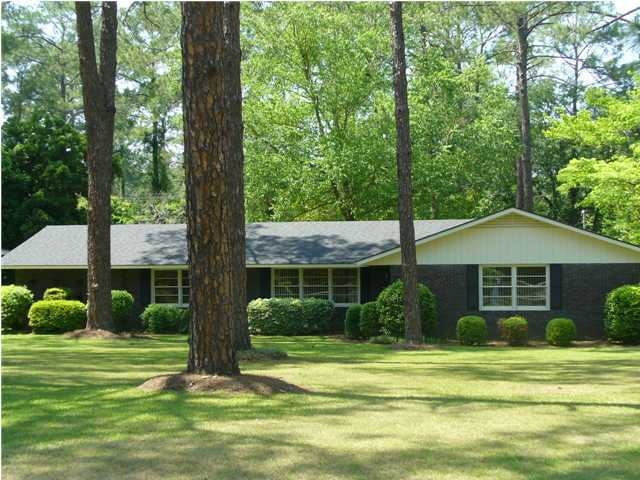
SUPER DEAL! Charming remodeled home in northwest neighborhood. Property features living room, dining room, den, large laundry room, 3 bedrooms, 2 baths. Lovely fenced backyard, storage room, carport. New paint inside and out, new roof, new hot water heater, beautifully refinshed oak floors, new carpet, new tile, too many improvements to mention. Great Neighborhood Watch program. Call your Realtor today!
Last Agent to Sell the Property
Penni Ivy
Coldwell Banker Walden & Kirkland Brokerage Phone: 2294368811 License #181168 Listed on: 04/20/2012
| Date | Buyer | Sale Price | Title Company |
|---|---|---|---|
| Spann James C | $100,000 | -- | |
| Kirkland Terri Ann | -- | -- | |
| Kirkland Terri Ann | $88,500 | -- | |
| Tappan Moore | -- | -- | |
| Tappan Moore | $81,000 | -- | |
| Meyer Von Bremen P | $75,000 | -- |
| Date | Status | Borrower | Loan Amount |
|---|---|---|---|
| Open | Spann James C | $97,465 |
| Date | Event | Price | List to Sale | Price per Sq Ft |
|---|---|---|---|---|
| 05/15/2012 05/15/12 | Sold | $100,000 | -- | $52 / Sq Ft |
| 04/20/2012 04/20/12 | Pending | -- | -- | -- |
| Year | Tax Paid | Tax Assessment Tax Assessment Total Assessment is a certain percentage of the fair market value that is determined by local assessors to be the total taxable value of land and additions on the property. | Land | Improvement |
|---|---|---|---|---|
| 2024 | $1,950 | $42,880 | $8,480 | $34,400 |
| 2023 | $1,066 | $42,880 | $8,480 | $34,400 |
| 2022 | $1,912 | $42,880 | $8,480 | $34,400 |
| 2021 | $1,772 | $42,880 | $8,480 | $34,400 |
| 2020 | $1,776 | $42,880 | $8,480 | $34,400 |
| 2019 | $1,783 | $42,880 | $8,480 | $34,400 |
| 2018 | $1,791 | $42,880 | $8,480 | $34,400 |
| 2017 | $1,668 | $42,880 | $8,480 | $34,400 |
| 2016 | $1,669 | $42,880 | $8,480 | $34,400 |
| 2015 | $1,674 | $42,880 | $8,480 | $34,400 |
| 2014 | $1,653 | $42,880 | $8,480 | $34,400 |
P
Seller's Agent in 2012
Penni Ivy
Coldwell Banker Walden & Kirkland

Buyer's Agent in 2012
Molly Swan
Re/Max Of Albany
(229) 344-2268
1 in this area
103 Total Sales
Source: Albany Board of REALTORS®
MLS Number: 124203
APN: 000GG-00021-009