511 Cedar Ridge Ln Smithville, TN 37166
Estimated Value: $775,727 - $858,000
4
Beds
4
Baths
3,011
Sq Ft
$266/Sq Ft
Est. Value
About This Home
This home is located at 511 Cedar Ridge Ln, Smithville, TN 37166 and is currently estimated at $801,932, approximately $266 per square foot. 511 Cedar Ridge Ln is a home located in DeKalb County.
Ownership History
Date
Name
Owned For
Owner Type
Purchase Details
Closed on
Jan 13, 2024
Sold by
Richey Wendy A
Bought by
Wendy Richey Revocable Trust
Current Estimated Value
Purchase Details
Closed on
May 4, 2023
Sold by
Williams Shane and Williams Kristi
Bought by
Richey Wendy A
Home Financials for this Owner
Home Financials are based on the most recent Mortgage that was taken out on this home.
Original Mortgage
$592,000
Interest Rate
6.42%
Mortgage Type
New Conventional
Purchase Details
Closed on
Apr 27, 2023
Sold by
Mayo James R and Mayo Elizabeth S
Bought by
Valenzuela Kelsie and Valenzuela Paul
Home Financials for this Owner
Home Financials are based on the most recent Mortgage that was taken out on this home.
Original Mortgage
$592,000
Interest Rate
6.42%
Mortgage Type
New Conventional
Purchase Details
Closed on
May 28, 2014
Sold by
Northwest Georgia Bank
Bought by
Ross Corey and White James L
Purchase Details
Closed on
Sep 23, 2009
Bought by
Northwest Georgia Bank
Purchase Details
Closed on
Nov 14, 2006
Bought by
Special Properties
Create a Home Valuation Report for This Property
The Home Valuation Report is an in-depth analysis detailing your home's value as well as a comparison with similar homes in the area
Home Values in the Area
Average Home Value in this Area
Purchase History
| Date | Buyer | Sale Price | Title Company |
|---|---|---|---|
| Wendy Richey Revocable Trust | -- | None Listed On Document | |
| Richey Wendy A | $740,588 | Dekalb Title | |
| Valenzuela Kelsie | $45,000 | Dekalb Title | |
| Ross Corey | $225,000 | -- | |
| Northwest Georgia Bank | $1,917,300 | -- | |
| Special Properties | $875,000 | -- |
Source: Public Records
Mortgage History
| Date | Status | Borrower | Loan Amount |
|---|---|---|---|
| Previous Owner | Richey Wendy A | $592,000 |
Source: Public Records
Tax History Compared to Growth
Tax History
| Year | Tax Paid | Tax Assessment Tax Assessment Total Assessment is a certain percentage of the fair market value that is determined by local assessors to be the total taxable value of land and additions on the property. | Land | Improvement |
|---|---|---|---|---|
| 2024 | $2,885 | $114,925 | $7,500 | $107,425 |
| 2023 | $2,103 | $105,150 | $7,500 | $97,650 |
| 2022 | $1,117 | $64,525 | $7,500 | $57,025 |
| 2021 | $130 | $7,500 | $7,500 | $0 |
| 2020 | $70 | $7,500 | $7,500 | $0 |
| 2019 | $70 | $3,275 | $3,275 | $0 |
| 2018 | $60 | $3,275 | $3,275 | $0 |
| 2017 | $60 | $3,275 | $3,275 | $0 |
| 2016 | $60 | $3,275 | $3,275 | $0 |
| 2015 | $53 | $3,275 | $3,275 | $0 |
| 2014 | -- | $3,500 | $3,500 | $0 |
| 2013 | $57 | $3,500 | $3,500 | $0 |
Source: Public Records
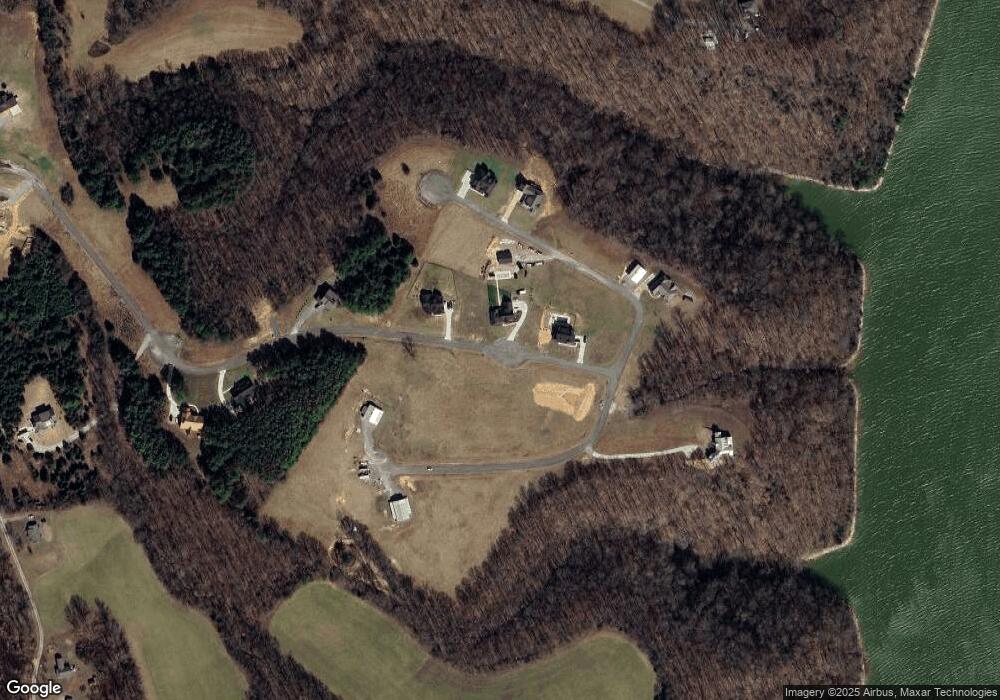
Map
Nearby Homes
- 0 Meadow View Ln
- 685 Young Green Rd
- 4250 Four Seasons Rd
- 0 Fish Hook Dr Unit RTC2820174
- 0 Fish Hook Dr Unit RTC2820171
- 201 4 Star Loop
- 175 4 Star Loop
- 1142 Poss Rd
- 0 Four Seasons Rd Unit 238579
- 0 Four Seasons Rd Unit RTC2972986
- 0 Stacey Rd Unit RTC2819082
- 0 4 Seasons Rd
- 5207 Four Seasons Rd
- 651 Judkins Ln N
- 0 W Park Dr Unit RTC2922685
- 341 Rigsby Rd
- 148 January Place
- 0 W Hutchins Bend Rd Unit 236643
- 0 W Hutchins Bend Rd Unit RTC2887744
- 0 W Hutchins Bend Rd Unit RTC2778655
- 511 Cedar Ridge Ln
- 473 Cedar Ridge Ln
- 557 Cedar Ridge Ln
- 252 Meadow View Ln
- 275 Stonecrest Ln
- 150 Meadow View Ln
- 24 Cedar Ridge Ln
- 25 Cedar Ridge Ln
- 21 Cedar Ridge Ln
- 23 Cedar Ridge Ln
- 20 Cedar Ridge Ln
- 22 Cedar Ridge Ln
- 19 Cedar Ridge Ln
- 18 Cedar Ridge Ln
- 1 Cedar Ridge Ln
- 314 Cedar Ridge Ln
- 131 Stonecrest Ln
- 314 Cedar Rdg Ln
- 31 Cedar Ridge Ln
- 30 Cedar Ridge Ln