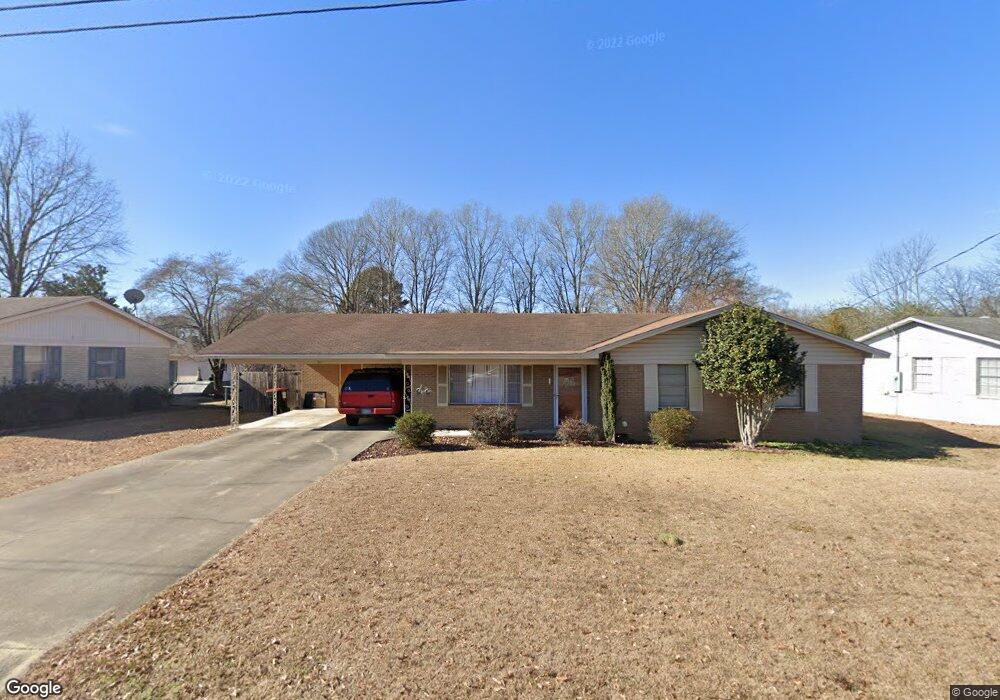
511 Dobbs St Benton, AR 72015
Estimated Value: $173,153 - $194,000
Studio
2
Baths
1,550
Sq Ft
$117/Sq Ft
Est. Value
About This Home
This home is located at 511 Dobbs St, Benton, AR 72015 and is currently estimated at $181,788, approximately $117 per square foot. 511 Dobbs St is a home located in Saline County with nearby schools including Ringgold Elementary School, Benton Middle School, and Benton Junior High School.
Ownership History
Date
Name
Owned For
Owner Type
Purchase Details
Closed on
Feb 27, 2009
Sold by
Berryhill Laura
Bought by
Adcock Jerry A and Adcock Andrea M
Current Estimated Value
Home Financials for this Owner
Home Financials are based on the most recent Mortgage that was taken out on this home.
Original Mortgage
$106,779
Outstanding Balance
$66,845
Interest Rate
4.92%
Mortgage Type
FHA
Estimated Equity
$114,943
Purchase Details
Closed on
Mar 10, 2006
Sold by
Jackson Donna J Arnold and Jackson Steve D
Bought by
Berryhill Laura
Home Financials for this Owner
Home Financials are based on the most recent Mortgage that was taken out on this home.
Original Mortgage
$94,254
Interest Rate
6.21%
Mortgage Type
FHA
Purchase Details
Closed on
May 3, 2002
Bought by
Arnold
Purchase Details
Closed on
Jul 24, 2001
Bought by
Cummings
Purchase Details
Closed on
May 1, 1991
Bought by
Steven and Steven Gregory
Create a Home Valuation Report for This Property
The Home Valuation Report is an in-depth analysis detailing your home's value as well as a comparison with similar homes in the area
Home Values in the Area
Average Home Value in this Area
Purchase History
| Date | Buyer | Sale Price | Title Company |
|---|---|---|---|
| Adcock Jerry A | $109,000 | -- | |
| Berryhill Laura | -- | -- | |
| Arnold | $79,000 | -- | |
| Cummings | $75,000 | -- | |
| Steven | -- | -- |
Source: Public Records
Mortgage History
| Date | Status | Borrower | Loan Amount |
|---|---|---|---|
| Open | Adcock Jerry A | $106,779 | |
| Previous Owner | Berryhill Laura | $94,254 |
Source: Public Records
Tax History
| Year | Tax Paid | Tax Assessment Tax Assessment Total Assessment is a certain percentage of the fair market value that is determined by local assessors to be the total taxable value of land and additions on the property. | Land | Improvement |
|---|---|---|---|---|
| 2025 | $991 | $17,883 | $5,200 | $12,683 |
| 2024 | $1,014 | $17,883 | $5,200 | $12,683 |
| 2023 | $566 | $17,883 | $5,200 | $12,683 |
| 2022 | $616 | $17,883 | $5,200 | $12,683 |
| 2021 | $695 | $19,310 | $4,000 | $15,310 |
| 2020 | $695 | $19,310 | $4,000 | $15,310 |
| 2019 | $695 | $19,310 | $4,000 | $15,310 |
| 2018 | $718 | $19,310 | $4,000 | $15,310 |
| 2017 | $716 | $19,310 | $4,000 | $15,310 |
| 2016 | $1,011 | $17,830 | $3,200 | $14,630 |
| 2015 | $643 | $17,830 | $3,200 | $14,630 |
| 2014 | $650 | $17,830 | $3,200 | $14,630 |
Source: Public Records
Map
Nearby Homes
Your Personal Tour Guide
Ask me questions while you tour the home.