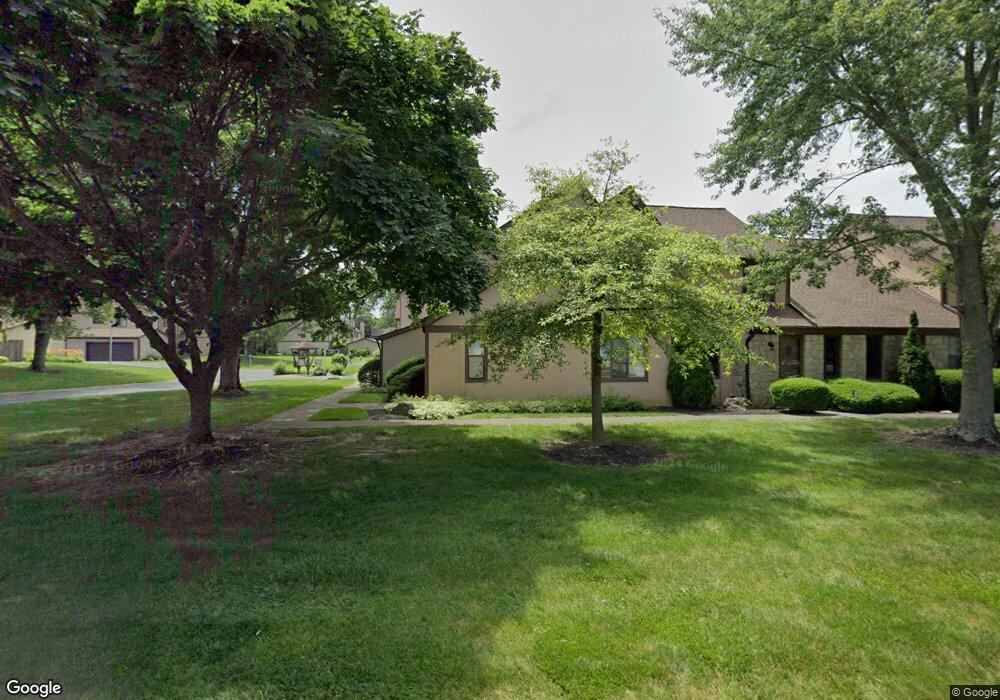
511 Durbin Rd Columbus, OH 43213
Olde Orchard NeighborhoodEstimated Value: $164,000 - $200,463
2
Beds
2
Baths
1,308
Sq Ft
$141/Sq Ft
Est. Value
About This Home
This home is located at 511 Durbin Rd, Columbus, OH 43213 and is currently estimated at $184,366, approximately $140 per square foot. 511 Durbin Rd is a home located in Franklin County with nearby schools including Olde Orchard Elementary School, Sherwood Middle School, and Walnut Ridge High School.
Ownership History
Date
Name
Owned For
Owner Type
Purchase Details
Closed on
Mar 10, 2021
Sold by
Longbottom Bryan and Sehrt Liane
Bought by
Abercrombie Cheryl and Sanford James
Current Estimated Value
Purchase Details
Closed on
Dec 14, 2020
Sold by
Longbottom Laurie
Bought by
Longbottom Bryan and Longbottom Liane
Purchase Details
Closed on
Dec 10, 2020
Sold by
Longbottom Laurie
Bought by
Longbottom Bryan and Longbottom Liane
Purchase Details
Closed on
Feb 2, 2018
Sold by
Massie Linda and Massie David C
Bought by
Longbottom Laurie
Purchase Details
Closed on
Oct 23, 2013
Sold by
Epelbaum Guido C
Bought by
Massie Linda and Massie Davidc
Home Financials for this Owner
Home Financials are based on the most recent Mortgage that was taken out on this home.
Original Mortgage
$65,272
Interest Rate
4.5%
Mortgage Type
FHA
Purchase Details
Closed on
Apr 30, 2013
Sold by
Crayton Peggy L and Gray Sherry
Bought by
Epelbaum Guido C
Purchase Details
Closed on
May 30, 1986
Bought by
Barrington William L
Create a Home Valuation Report for This Property
The Home Valuation Report is an in-depth analysis detailing your home's value as well as a comparison with similar homes in the area
Home Values in the Area
Average Home Value in this Area
Purchase History
| Date | Buyer | Sale Price | Title Company |
|---|---|---|---|
| Abercrombie Cheryl | $129,000 | Valmer Land Title Agency | |
| Longbottom Bryan | -- | None Available | |
| Longbottom Bryan | -- | None Listed On Document | |
| Longbottom Laurie | $104,000 | None Available | |
| Massie Linda | $66,500 | Quality Choice Title Box | |
| Epelbaum Guido C | $45,000 | Talon Title | |
| Barrington William L | $67,500 | -- |
Source: Public Records
Mortgage History
| Date | Status | Borrower | Loan Amount |
|---|---|---|---|
| Previous Owner | Massie Linda | $65,272 |
Source: Public Records
Tax History
| Year | Tax Paid | Tax Assessment Tax Assessment Total Assessment is a certain percentage of the fair market value that is determined by local assessors to be the total taxable value of land and additions on the property. | Land | Improvement |
|---|---|---|---|---|
| 2025 | $2,542 | $56,630 | $11,900 | $44,730 |
| 2024 | $2,542 | $56,630 | $11,900 | $44,730 |
| 2023 | $2,509 | $56,630 | $11,900 | $44,730 |
| 2022 | $2,044 | $39,410 | $6,160 | $33,250 |
| 2021 | $2,098 | $39,410 | $6,160 | $33,250 |
| 2020 | $2,050 | $39,410 | $6,160 | $33,250 |
| 2019 | $1,839 | $30,320 | $4,730 | $25,590 |
| 2018 | $1,669 | $30,320 | $4,730 | $25,590 |
| 2017 | $1,747 | $30,320 | $4,730 | $25,590 |
| 2016 | $1,655 | $24,990 | $4,620 | $20,370 |
| 2015 | $1,503 | $24,990 | $4,620 | $20,370 |
| 2014 | $1,506 | $24,990 | $4,620 | $20,370 |
| 2013 | $956 | $31,255 | $5,775 | $25,480 |
Source: Public Records
Map
Nearby Homes
- 6279 Braiden Ct Unit 10B
- 541 Woodingham Place Unit 2-C
- 544 Waring Way
- 622 Brice Rd
- 458 Brice Rd
- 787 Persimmon Place
- 445 Hawthorne Place
- 6571 Schenk Ave
- 6560 Schenk Ave
- Oxford Plan at Icon Villas at McNaughten
- Ashton Plan at Icon Villas at McNaughten
- 6483 Borr Ave
- 6415 Old Church Way
- 6033 McNaughten Grove Ln
- 117 Stornoway Dr E
- 5909 Whitman Rd
- 85 Stornoway Dr W Unit 85
- 893 Hunt Valley Dr
- 6737 Rocky Den Rd
- 142 Villamere Dr Unit 6
- 511 Durbin Rd Unit A
- 509 Durbin Rd Unit 41/B
- 507 Durbin Rd
- 507 Durbin Rd Unit C
- 6311 Sabastian Ct Unit 42D
- 6307 Sabastian Ct
- 6311 Sabastian Ct Unit D
- 505 Durbin Rd
- 6323 Sabastian Ct
- 6321 Sabastian Ct
- 6321 Sabastian Ct Unit C
- 6319 Sabastian Ct
- 6317 Sabastian Ct
- 6317 Sabastian Ct Unit A
- 6349 Plankton Dr
- 533 Durbin Rd Unit 35B
- 533 Durbin Rd Unit B
- 6368 Claypool Ct
- 6305 Sabastian Ct Unit 42A
- 6305 Sabastian Ct Unit A
Your Personal Tour Guide
Ask me questions while you tour the home.