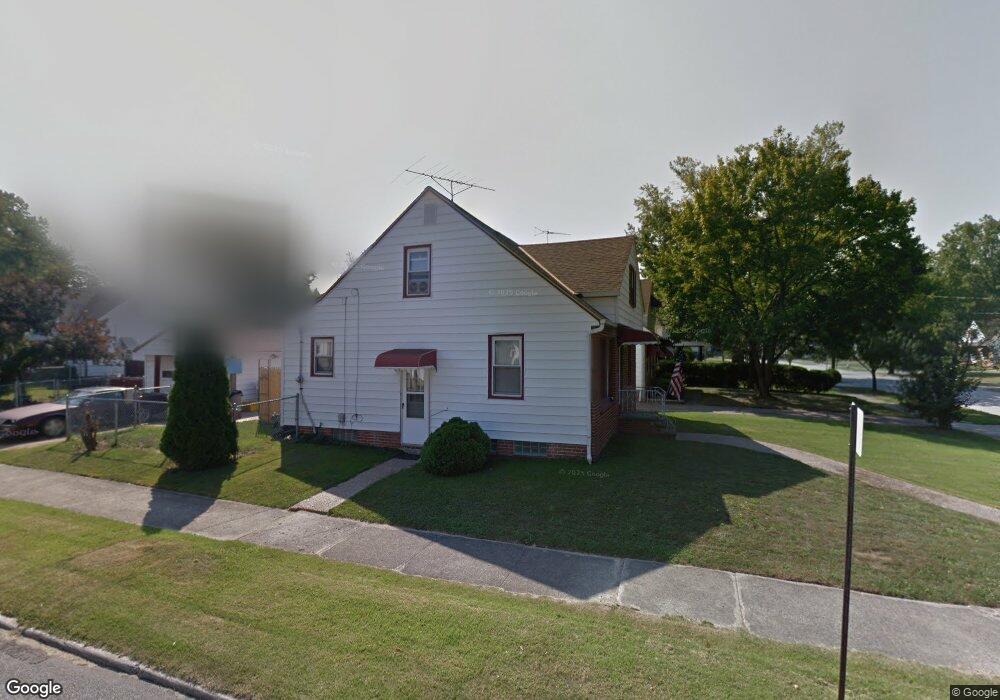
511 E 253rd St Euclid, OH 44132
Estimated Value: $117,000 - $147,000
2
Beds
1
Bath
838
Sq Ft
$154/Sq Ft
Est. Value
About This Home
This home is located at 511 E 253rd St, Euclid, OH 44132 and is currently estimated at $129,112, approximately $154 per square foot. 511 E 253rd St is a home located in Cuyahoga County with nearby schools including Shoreview Elementary School, Euclid High School, and Pinnacle Academy.
Ownership History
Date
Name
Owned For
Owner Type
Purchase Details
Closed on
Dec 4, 2002
Sold by
Cook Chad R and Cook Jennifer D
Bought by
Semperger Denis D
Current Estimated Value
Home Financials for this Owner
Home Financials are based on the most recent Mortgage that was taken out on this home.
Original Mortgage
$78,600
Outstanding Balance
$32,221
Interest Rate
6.38%
Estimated Equity
$96,891
Purchase Details
Closed on
Feb 26, 1998
Sold by
Muffler Carmella A and Whitkosky Estelle M
Bought by
Cook Chad R and Sharaba Jennifer D
Home Financials for this Owner
Home Financials are based on the most recent Mortgage that was taken out on this home.
Original Mortgage
$49,080
Interest Rate
6.95%
Mortgage Type
FHA
Purchase Details
Closed on
Oct 5, 1993
Sold by
Muffler Carmella A
Bought by
Muffler Carmella A
Purchase Details
Closed on
May 4, 1987
Sold by
Muffler Daniel J and Muffler Carmella A
Bought by
Muffler Carmella A
Purchase Details
Closed on
Jan 1, 1975
Bought by
Muffler Daniel J and Muffler Carmella A
Create a Home Valuation Report for This Property
The Home Valuation Report is an in-depth analysis detailing your home's value as well as a comparison with similar homes in the area
Home Values in the Area
Average Home Value in this Area
Purchase History
| Date | Buyer | Sale Price | Title Company |
|---|---|---|---|
| Semperger Denis D | $92,500 | Progressive Land Title | |
| Cook Chad R | $73,000 | Real Estate Title | |
| Muffler Carmella A | -- | -- | |
| Muffler Carmella A | -- | -- | |
| Muffler Daniel J | -- | -- |
Source: Public Records
Mortgage History
| Date | Status | Borrower | Loan Amount |
|---|---|---|---|
| Open | Semperger Denis D | $78,600 | |
| Previous Owner | Cook Chad R | $49,080 |
Source: Public Records
Tax History
| Year | Tax Paid | Tax Assessment Tax Assessment Total Assessment is a certain percentage of the fair market value that is determined by local assessors to be the total taxable value of land and additions on the property. | Land | Improvement |
|---|---|---|---|---|
| 2025 | $1,792 | $37,030 | $8,785 | $28,245 |
| 2024 | $1,946 | $37,030 | $8,785 | $28,245 |
| 2023 | $1,831 | $29,580 | $6,650 | $22,930 |
| 2022 | $1,824 | $29,580 | $6,650 | $22,930 |
| 2021 | $2,023 | $29,580 | $6,650 | $22,930 |
| 2020 | $1,806 | $25,520 | $5,740 | $19,780 |
| 2019 | $1,621 | $72,900 | $16,400 | $56,500 |
| 2018 | $1,111 | $25,520 | $5,740 | $19,780 |
| 2017 | $1,627 | $22,650 | $4,760 | $17,890 |
| 2016 | $1,630 | $22,650 | $4,760 | $17,890 |
| 2015 | $2,395 | $22,650 | $4,760 | $17,890 |
| 2014 | $2,395 | $22,650 | $4,760 | $17,890 |
Source: Public Records
Map
Nearby Homes
- 25401 Farringdon Ave
- 25370 Drakefield Ave
- 25151 Zeman Ave
- 25671 Farringdon Ave
- 515 E 250th St
- 464 E 250th St
- 25731 Zeman Ave
- 24891 Zeman Ave
- 24791 Drakefield Ave
- 25650 Richards Ave
- 579 E 260th St
- 571 E 260th St
- 563 E 260th St
- 344 E 246th St
- 643 E 261st St
- 26171 Shoreview Ave
- 325 E 244th St
- 25591 Forestview Ave
- 355 E 257th St
- 26530 Shoreview Ave
- 515 E 253rd St
- 521 E 253rd St
- 495 E 253rd St
- 25350 Farringdon Ave
- 525 E 253rd St
- 491 E 253rd St
- 25351 Farringdon Ave
- 531 E 253rd St
- 25400 Farringdon Ave
- 510 E 253rd St
- 514 E 253rd St
- 485 E 253rd St
- 25371 Farringdon Ave
- 25351 Drakefield Ave
- 520 E 253rd St
- 494 E 253rd St
- 535 E 253rd St
- 25371 Drakefield Ave
- 524 E 253rd St
- 490 E 253rd St
Your Personal Tour Guide
Ask me questions while you tour the home.