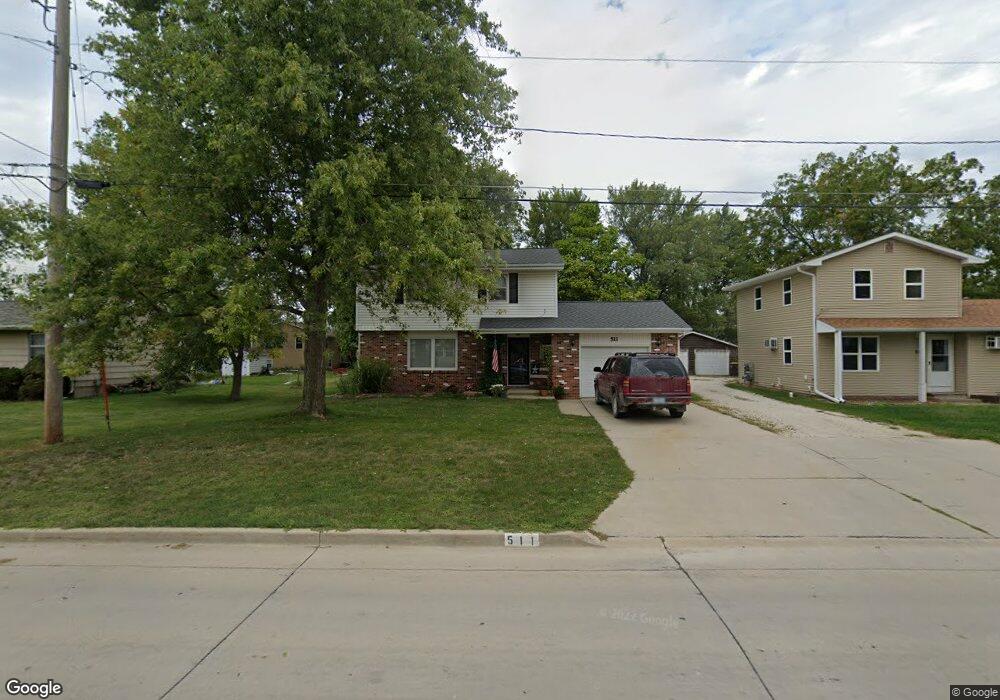
511 E Ayers St Osceola, IA 50213
Estimated Value: $184,253 - $212,000
3
Beds
2
Baths
1,372
Sq Ft
$141/Sq Ft
Est. Value
About This Home
This home is located at 511 E Ayers St, Osceola, IA 50213 and is currently estimated at $193,313, approximately $140 per square foot. 511 E Ayers St is a home located in Clarke County with nearby schools including Clarke Community Elementary School, Clarke Middle School, and Clarke Community High School.
Ownership History
Date
Name
Owned For
Owner Type
Purchase Details
Closed on
Jun 29, 2012
Sold by
Lowe Brad and Roe Cassondra
Bought by
Yonker Jerald J
Current Estimated Value
Home Financials for this Owner
Home Financials are based on the most recent Mortgage that was taken out on this home.
Original Mortgage
$126,530
Outstanding Balance
$86,501
Interest Rate
3.77%
Mortgage Type
New Conventional
Estimated Equity
$106,812
Purchase Details
Closed on
May 27, 2011
Sold by
Williams Brandon J
Bought by
Howe Bradley W and Roe Cassondra
Home Financials for this Owner
Home Financials are based on the most recent Mortgage that was taken out on this home.
Original Mortgage
$106,913
Interest Rate
4.87%
Mortgage Type
FHA
Purchase Details
Closed on
Feb 9, 2007
Sold by
Ahrens Marilyn R
Bought by
Williams Brandon J
Home Financials for this Owner
Home Financials are based on the most recent Mortgage that was taken out on this home.
Original Mortgage
$104,000
Interest Rate
6.22%
Mortgage Type
New Conventional
Create a Home Valuation Report for This Property
The Home Valuation Report is an in-depth analysis detailing your home's value as well as a comparison with similar homes in the area
Home Values in the Area
Average Home Value in this Area
Purchase History
| Date | Buyer | Sale Price | Title Company |
|---|---|---|---|
| Yonker Jerald J | $121,000 | None Available | |
| Howe Bradley W | $110,000 | None Available | |
| Williams Brandon J | $104,000 | None Available |
Source: Public Records
Mortgage History
| Date | Status | Borrower | Loan Amount |
|---|---|---|---|
| Open | Yonker Jerald J | $126,530 | |
| Previous Owner | Howe Bradley W | $106,913 | |
| Previous Owner | Williams Brandon J | $104,000 |
Source: Public Records
Tax History
| Year | Tax Paid | Tax Assessment Tax Assessment Total Assessment is a certain percentage of the fair market value that is determined by local assessors to be the total taxable value of land and additions on the property. | Land | Improvement |
|---|---|---|---|---|
| 2025 | $3,298 | $182,440 | $14,700 | $167,740 |
| 2024 | $3,298 | $166,790 | $11,760 | $155,030 |
| 2023 | $3,208 | $166,790 | $11,760 | $155,030 |
| 2022 | $3,074 | $144,990 | $10,310 | $134,680 |
| 2021 | $2,728 | $121,560 | $8,640 | $112,920 |
| 2020 | $2,650 | $121,560 | $8,640 | $112,920 |
| 2019 | $2,754 | $121,560 | $0 | $0 |
| 2018 | $2,672 | $121,560 | $0 | $0 |
| 2017 | $2,556 | $111,530 | $0 | $0 |
| 2016 | $2,516 | $111,530 | $0 | $0 |
| 2014 | $2,346 | $101,260 | $0 | $0 |
Source: Public Records
Map
Nearby Homes
- 520 E Webster St
- 805 E Clay St
- 117 W Logan St
- 116 S Park St
- 125 W Logan St
- 608 N Fillmore St
- 213 W Logan St
- 215 W Clay St
- 624 N Fillmore St
- 127 W Garfield St
- 214 W Jefferson St
- 115 W Mclane St
- 124 E Grant St
- 215 N Lincoln St
- 114 E Grant St
- 101 N Lincoln St
- 120 E Pearl St
- 322 S Temple St
- 117 E May St
- 520 S Temple St
Your Personal Tour Guide
Ask me questions while you tour the home.