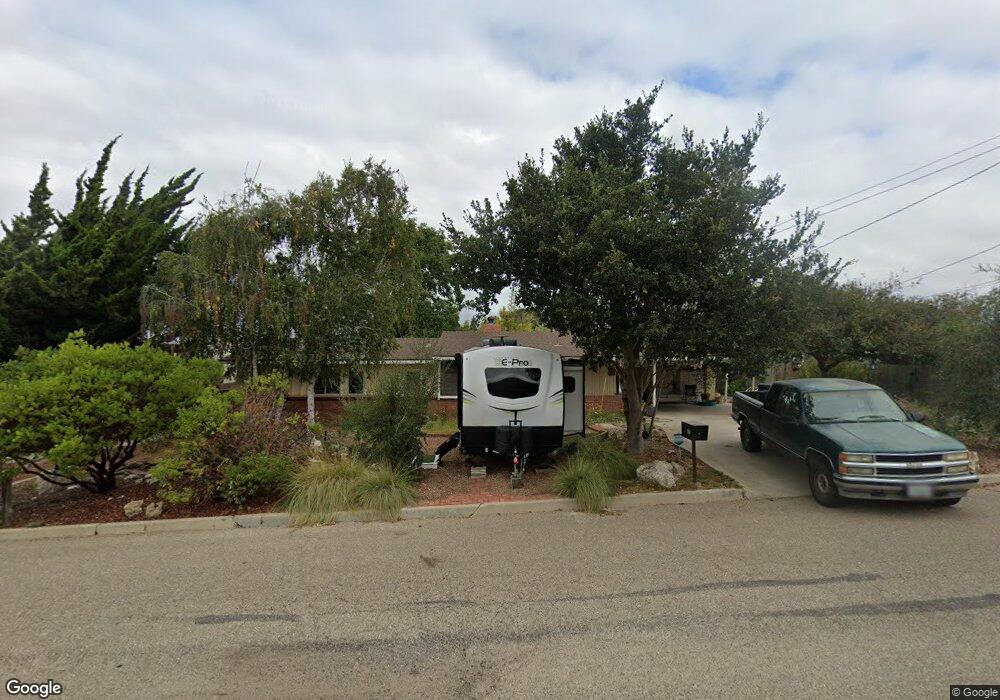
511 E Fir Ave Lompoc, CA 93436
Estimated Value: $521,902 - $628,000
3
Beds
2
Baths
1,225
Sq Ft
$459/Sq Ft
Est. Value
About This Home
This home is located at 511 E Fir Ave, Lompoc, CA 93436 and is currently estimated at $562,476, approximately $459 per square foot. 511 E Fir Ave is a home located in Santa Barbara County with nearby schools including Arthur Hapgood Elementary School, Lompoc Valley Middle School, and Lompoc High School.
Ownership History
Date
Name
Owned For
Owner Type
Purchase Details
Closed on
Sep 14, 2001
Sold by
Kappler Douglas D and Greene Valerie Denise
Bought by
Hurlbut Daniel T and Bennett Susan M
Current Estimated Value
Home Financials for this Owner
Home Financials are based on the most recent Mortgage that was taken out on this home.
Original Mortgage
$221,523
Outstanding Balance
$85,878
Interest Rate
6.91%
Mortgage Type
FHA
Estimated Equity
$476,598
Create a Home Valuation Report for This Property
The Home Valuation Report is an in-depth analysis detailing your home's value as well as a comparison with similar homes in the area
Home Values in the Area
Average Home Value in this Area
Purchase History
| Date | Buyer | Sale Price | Title Company |
|---|---|---|---|
| Hurlbut Daniel T | $225,000 | Chicago Title Co |
Source: Public Records
Mortgage History
| Date | Status | Borrower | Loan Amount |
|---|---|---|---|
| Open | Hurlbut Daniel T | $221,523 |
Source: Public Records
Tax History
| Year | Tax Paid | Tax Assessment Tax Assessment Total Assessment is a certain percentage of the fair market value that is determined by local assessors to be the total taxable value of land and additions on the property. | Land | Improvement |
|---|---|---|---|---|
| 2025 | $3,557 | $332,369 | $110,785 | $221,584 |
| 2023 | $3,557 | $319,465 | $106,484 | $212,981 |
| 2022 | $3,492 | $313,202 | $104,397 | $208,805 |
| 2021 | $3,529 | $307,061 | $102,350 | $204,711 |
| 2020 | $3,491 | $303,913 | $101,301 | $202,612 |
| 2019 | $3,432 | $297,955 | $99,315 | $198,640 |
| 2018 | $3,378 | $292,114 | $97,368 | $194,746 |
| 2017 | $3,315 | $286,387 | $95,459 | $190,928 |
| 2016 | $3,253 | $280,773 | $93,588 | $187,185 |
| 2014 | $3,182 | $271,141 | $90,378 | $180,763 |
Source: Public Records
Map
Nearby Homes
Your Personal Tour Guide
Ask me questions while you tour the home.