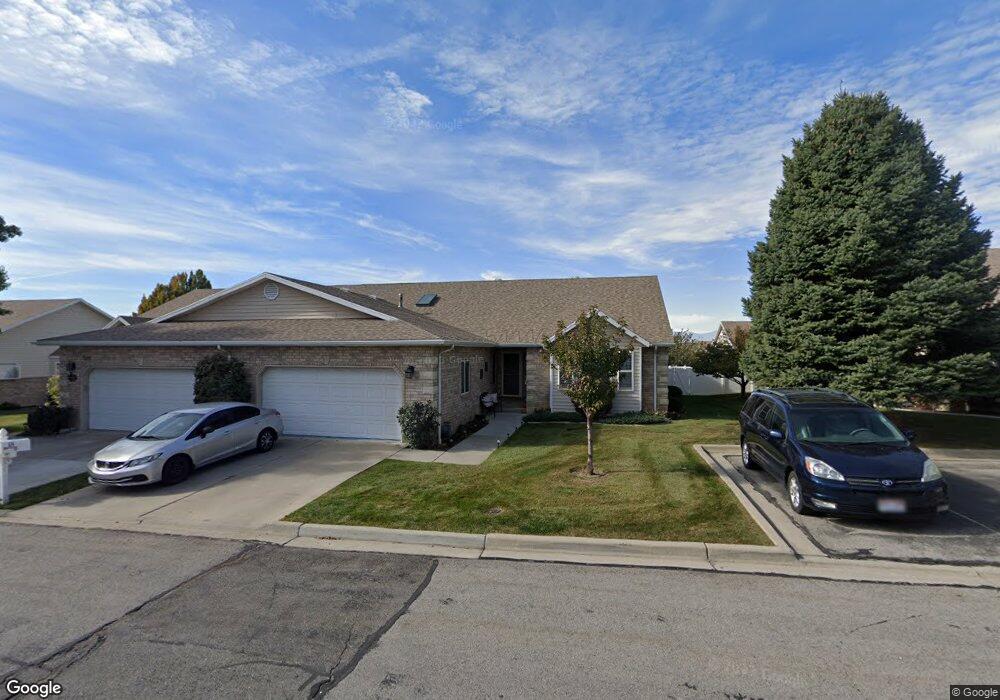
511 N 40 W Unit 26 Lindon, UT 84042
Estimated Value: $572,000 - $625,000
4
Beds
3
Baths
3,900
Sq Ft
$153/Sq Ft
Est. Value
About This Home
This home is located at 511 N 40 W Unit 26, Lindon, UT 84042 and is currently estimated at $594,859, approximately $152 per square foot. 511 N 40 W Unit 26 is a home located in Utah County with nearby schools including Lindon Elementary School, Oak Canyon Junior High School, and Pleasant Grove High School.
Ownership History
Date
Name
Owned For
Owner Type
Purchase Details
Closed on
May 2, 2023
Sold by
Fami Dale M and Fami Joanne
Bought by
Santos Jose L and Rosario America Maria
Current Estimated Value
Home Financials for this Owner
Home Financials are based on the most recent Mortgage that was taken out on this home.
Original Mortgage
$540,038
Outstanding Balance
$525,104
Interest Rate
6.42%
Mortgage Type
Construction
Estimated Equity
$69,755
Purchase Details
Closed on
Mar 23, 2012
Sold by
Raddatz Dale M and Raddatz Joanne S
Bought by
Raddatz Dale M and Raddatz Joanne S
Create a Home Valuation Report for This Property
The Home Valuation Report is an in-depth analysis detailing your home's value as well as a comparison with similar homes in the area
Home Values in the Area
Average Home Value in this Area
Purchase History
| Date | Buyer | Sale Price | Title Company |
|---|---|---|---|
| Santos Jose L | -- | Truly Title | |
| Raddatz Dale M | -- | None Available |
Source: Public Records
Mortgage History
| Date | Status | Borrower | Loan Amount |
|---|---|---|---|
| Open | Santos Jose L | $540,038 |
Source: Public Records
Tax History
| Year | Tax Paid | Tax Assessment Tax Assessment Total Assessment is a certain percentage of the fair market value that is determined by local assessors to be the total taxable value of land and additions on the property. | Land | Improvement |
|---|---|---|---|---|
| 2025 | $2,424 | $293,205 | -- | -- |
| 2024 | $2,424 | $298,870 | $0 | $0 |
| 2023 | $1,951 | $258,390 | $0 | $0 |
| 2022 | $1,779 | $227,535 | $0 | $0 |
| 2021 | $1,535 | $296,000 | $35,500 | $260,500 |
| 2020 | $709 | $296,000 | $35,500 | $260,500 |
| 2019 | $1,409 | $279,000 | $33,500 | $245,500 |
| 2018 | $1,333 | $249,000 | $29,900 | $219,100 |
| 2017 | $633 | $136,950 | $0 | $0 |
| 2016 | $649 | $128,700 | $0 | $0 |
| 2015 | $701 | $128,700 | $0 | $0 |
| 2014 | $612 | $114,950 | $0 | $0 |
Source: Public Records
Map
Nearby Homes
Your Personal Tour Guide
Ask me questions while you tour the home.